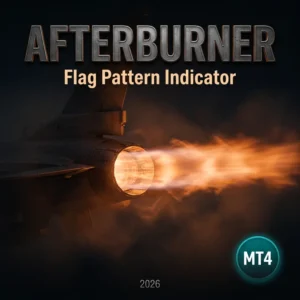
Afterburner, the flag pattern indicator MT5 that buys the pause, not the chase
Price rarely runs in a straight line. It thrusts, it rests for a few candles, and then it thrusts again. Traders who chase the first move get the worst price, while the ones who wait for the rest get the same trade with a fraction of the risk. Afterburner is a flag pattern indicator MT5 that measures the thrust, boxes the pause and fires on the candle that leaves the box.
The arrow does not repaint, does not move and does not disappear. It needs a closed candle, and once it prints it stays exactly where it printed.
 Click the image to enlarge
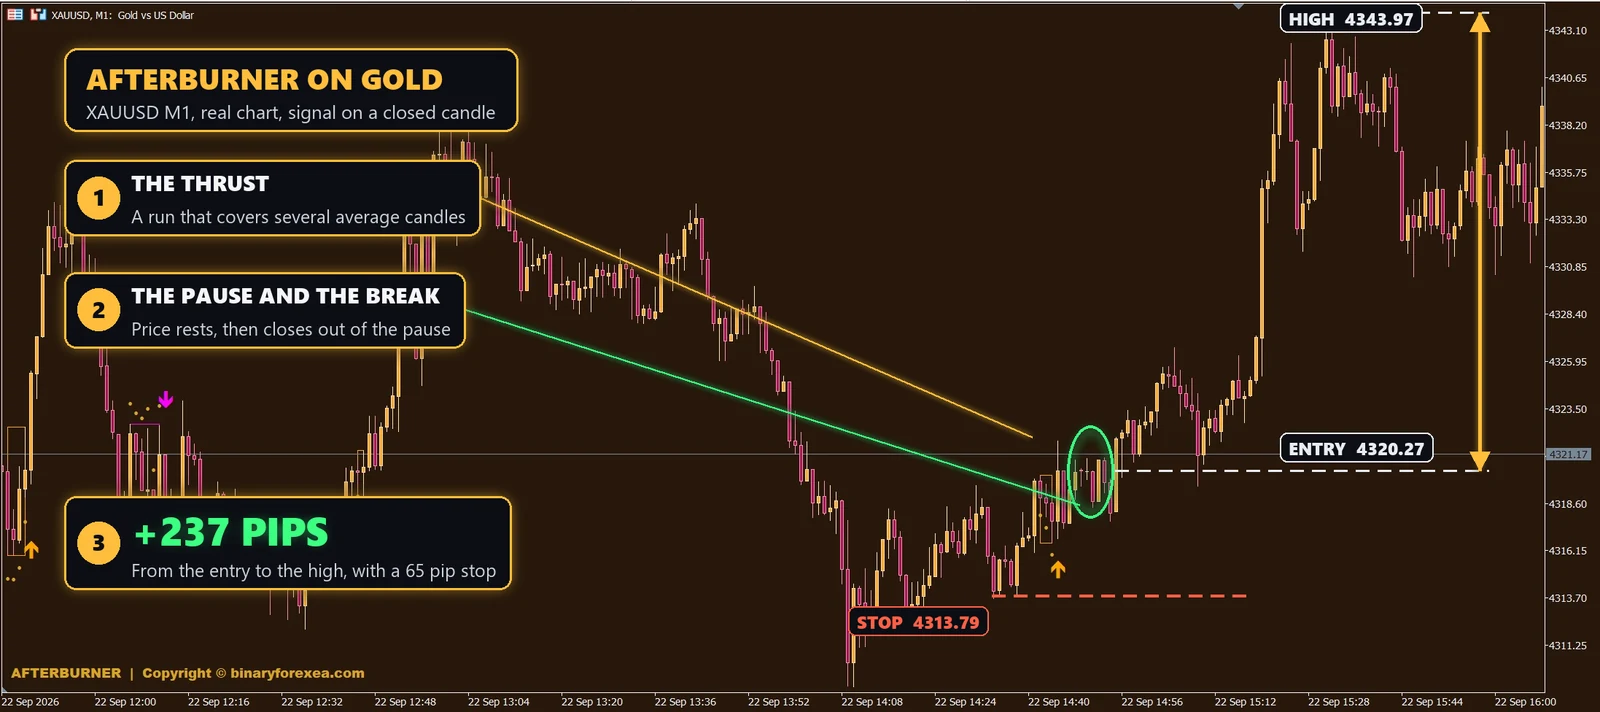
Real chart, gold on M1. First a run lifts price several average candles. Then the market rests inside a tight box, and a candle closes out of the top of it. The buy arrow prints at 4320.27 with the stop under the pause at 4313.79, a risk of 65 pips. From there gold climbed to 4343.97, a move of 237 pips, which is three and a half times the risk. Every price comes from the exact candle history of that chart.
Why the pause is the part that pays
A thrust tells you where the money went. However, the thrust itself is a terrible entry, because the stop has to sit on the other side of the whole run. The pause solves that problem: price stays still, the stop gets close, and the reward stays the same.
Therefore this tool never fires during the run. Instead, it waits for the market to breathe and then asks for a close beyond the pause. As a result the entry is late by design and cheap by design as well.
What this flag pattern indicator MT5 checks before it fires
- The thrust. A run of candles covering at least a couple of average ranges in one direction.
- The pause. Then two to eight candles that hold inside part of that run, without giving it back.
- The depth. After that, the pullback inside the pause has to stay under the share you allow.
- The break. Finally, a candle closes beyond the pause in the direction of the thrust.
Besides, the box of the pause stays drawn on the chart, so you can see exactly what the tool measured.
How to trade the signals
- Enter on the close of the arrow candle. By then the pause has already broken.
- Stop on the other side of the box, which is only a few candles away.
- Target the size of the thrust projected from the break, or trail behind each new pause.
- Trade with the day. Also, flags that point the same way as the session tend to travel further.
Markets and timeframes
| Gold XAUUSD | M1, the example above, very precise |
| EURUSD and the majors | M15 |
| All major pairs | M1 to H1, the same rules |
Gold on M1 is the sharpest chart for this pattern, because gold thrusts hard and rests briefly. In practice, M15 on the pairs gives fewer signals with wider targets.
What is inside
- The pause drawn as a box in buy or sell colour.
- Dots on the candles of the pause, so you see it forming before the break.
- Arrows on closed candles only. They do not repaint, move or disappear.
- Editable thrust length, thrust power, pause length and maximum pullback.
- Popup, sound, push and email alerts, each one switchable.
- Premium dark chart theme, applied on attach and restored on remove.
Besides, it reads price only, so any broker and any account works. If you want robots that trade by themselves, browse our automated robots, and the rest of the manual set is in our chart tools for traders.
Questions about this flag pattern indicator MT5
Does it repaint? No. The thrust and the pause are made of candles that already closed, and the break needs a closed candle as well.
Is this the classic bull flag? Yes, it is the same idea that every technical analysis book calls a flag, measured with numbers instead of eyesight.
How do I get more signals? Lower the thrust power, or allow a longer pause. Both settings sit at the top of the list.
Do you have the other version? Yes. This is the MetaTrader 5 build, and Afterburner for MT4 measures the same pauses on MetaTrader 4.
Trading involves risk. Signals are information, not advice, so try any new tool on a demo account first and only trade money you can afford to lose.