Pivot Point Calculator

Use this pivot point calculator to get the next session pivot, plus three supports and three resistances, from today’s high, low and close. Standard, Woodie, Camarilla and DeMark are all included, so you can plot exactly the same levels that the rest of the market is watching tomorrow morning.
What are Pivot Points?
In a price chart a pivot point is the sum of an instrument’s previous trading day high, close and low prices, divided by three. On the following trading session if the instrument’s price is below the pivot point level it can signal an ongoing downtrend, while if the instrument’s price is above the pivot point level it can be interpreted as an ongoing uptrend.
The pivot point calculating formula (High+Low+Close)/3 of a financial instrument maps out the pivot point levels consisting of the pivot level and the three levels of price support and resistance. These support and resistance price levels can be traded much the same way as trading from the regular support and resistance levels and trendlines, using a mix of breakout and bounce trading strategies.
The major advantage for the pivot point strategy is the fact that it is a very common one, as so many traders, including large institutional professional traders, use the same levels based on the same formula. Pivot point strategies are popular as those levels are predictive as opposed to lagging. Several traders use the calculations of an asset’s previous trading day price to calculate the possible reversal points, or breakout levels, for the current trading session.
Our Pivot Point Calculator will accurately calculate the 7 pivot points of any financial instrument’s price: the pivot point, the 3 resistance price levels, and the 3 support price levels. The three most common levels are the pivot point (PP), the first level of resistance (R1) and the first level of support (S1).
How to use the pivot point calculator
Type: In this field traders can select from four different pivot point calculation methods. The difference between the four different calculation methods is the number of levels considered and displayed:
- Standard method: 7 levels ranging between the R3 and S3.
- Woodie method: 5 levels ranging between the R2 and S2.
- Camarilla method: 9 levels ranging between the R4 and S4.
- DeMark method: requires the asset’s opening price and calculates only 2 levels ranging between the R1 and S1.
Let’s say, for example, that we want to calculate the Standard pivot points for the EUR/USD, and for the next trading session. Firstly, for our example, we will select the Standard calculation method.
High price: In this field we enter the highest price that the EUR/USD pair reached on the previous trading session, for example 1.20552.
Low price: Similar to the previous field, we enter the lowest price that the EUR/USD pair reached on the previous trading session, for example 1.19653.
Close price: Finally, we enter the closing price for the EUR/USD pair on the previous trading session, for example 1.20154.
Now, we hit the “Calculate” button.
The results: The Pivot Point Calculator (in Standard mode) will calculate and display the 7 pivot levels for the EUR/USD pair, for the next trading session. The PP level for the following day will be 1.2012 and the 3 support levels will be 1.1969 (S1), 1.1922 (S2) and 1.1879 (S3). The 3 resistance levels will be 1.2059 (R1), 1.2102 (R2) and 1.2149 (R3).
How the pivot point calculator builds each level
Basically, the central pivot is the average of yesterday’s high, low and close. Then everything else hangs off that one number, and the standard method uses these formulas.
- P = (High + Low + Close) divided by 3
- R1 = (2 x P) minus Low, and S1 = (2 x P) minus High
- R2 = P + (High minus Low), and S2 = P minus (High minus Low)
- R3 = High + 2 x (P minus Low), and S3 = Low minus 2 x (High minus P)
Because the inputs are yesterday’s finished candle, every trader who uses the same method draws exactly the same lines, and that shared agreement is where the levels get their power.

Pivot point calculator worked example on EUR/USD
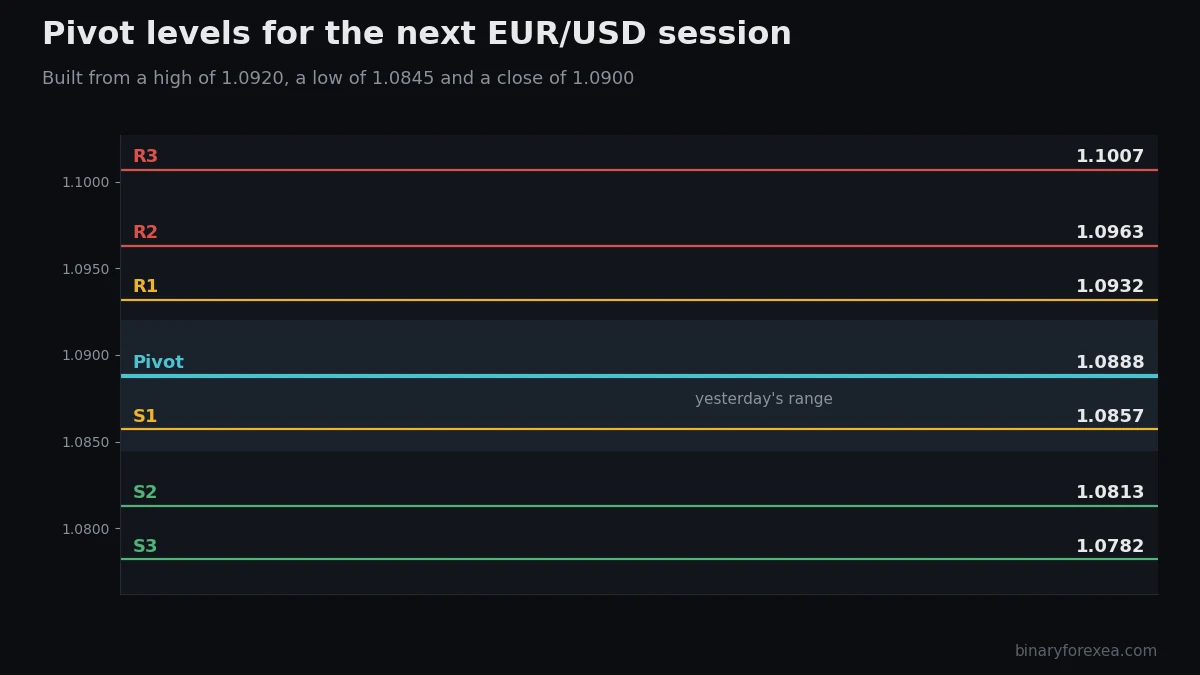
For example, suppose EUR/USD closed the session at 1.0900, after a high of 1.0920 and a low of 1.0845. In that case the arithmetic runs itself. The pivot point calculator then returns this ladder.
| Level | Price | How traders read it |
|---|---|---|
| R3 | 1.1007 | Rare, usually a news day |
| R2 | 1.0963 | Target after R1 breaks |
| R1 | 1.0932 | First resistance of the session |
| Pivot | 1.0888 | Above it bulls lead, below it bears do |
| S1 | 1.0857 | First support of the session |
| S2 | 1.0813 | Target after S1 breaks |
| S3 | 1.0782 | Rare, usually a news day |
Above all, notice how tight the ladder is on a quiet day. Indeed, a session that only moved 75 pips produces supports and resistances a few dozen pips apart, and that spacing itself tells you what kind of day to expect.
Standard, Woodie, Camarilla and DeMark in the pivot point calculator
Naturally, the four methods differ in what they weight and how many levels they draw.
- Standard. Seven levels, and obviously the version most platforms and most traders use.
- Woodie. Five levels, and it gives the close double weight, so it reacts faster to a strong finish.
- Camarilla. Nine levels clustered tightly around the close, which especially suits mean reversion inside the range.
- DeMark. Finally, this one depends on where the close sits against the open, and consequently it produces a single support and resistance pair.
Above all, pick one and stay with it. Switching methods until the lines agree with your opinion defeats the entire purpose.
How traders actually use pivot point calculator levels
Generally, the two common approaches pull in opposite directions, and both work in the right conditions. For example, on a quiet range day traders fade the outer levels, buying near S1 and selling near R1. Conversely, on a trend day they do the reverse, treating a clean break of R1 as a signal with R2 as the target.
However, the arithmetic matters more than the opinion, so measure the distance to the next level with the profit calculator before you take the trade. If you would rather have the levels plotted automatically on every chart, Deadbolt draws them for you and marks the reactions.
Pivot point calculator questions traders ask
Which session should I use? However you trade, daily pivots from the previous trading day suit intraday work. Meanwhile, weekly and monthly pivots matter to swing traders and they hold for far longer.
Do pivots work on gold and indices? Yes, and especially better than on currencies, because those markets respect round levels and have a clear daily range.
Why do my levels differ from my broker’s? Usually because the broker uses a different session close, since server times vary by several hours between brokers.
Are pivots better than moving averages? Actually, they are different tools. Pivots are fixed for the session and known in advance, whereas a moving average follows price and keeps changing while you watch it.
FREE
USEFUL LINKS
WEEKLY NEWSLETTER
We Accept
© binaryforexea.com - Todos los derechos reservados
Premium Expert Advisors
Looking for more advanced EAs with updates and support?



Updated in September 2026