
Live Signal
Professional indicators, trading signals, and proven strategies for manual forex traders on MT4 and MT5.


Learn how to use indicators, signals, and strategies to improve your manual forex trading results.
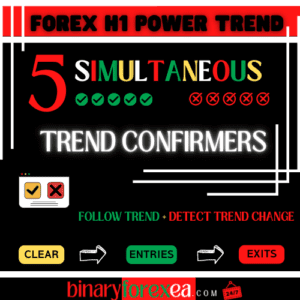
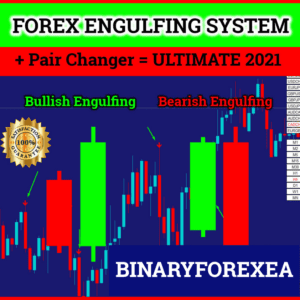
Forex indicators are technical analysis tools that overlay on your MetaTrader chart to help you identify trends, momentum, support/resistance levels, and potential entry/exit points. Unlike Expert Advisors, indicators don't trade automatically — they provide visual signals that you interpret and act on manually.
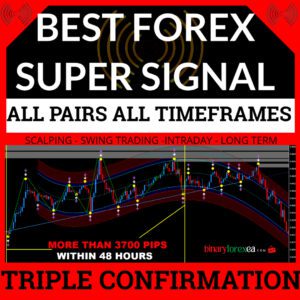
Common types include trend indicators (Moving Averages, Bollinger Bands), oscillators (RSI, Stochastic), volume indicators, and custom proprietary algorithms. The best indicators combine multiple data points to reduce false signals and increase accuracy.
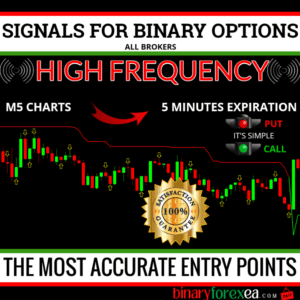
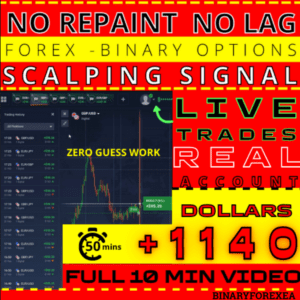
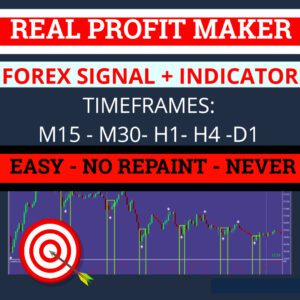
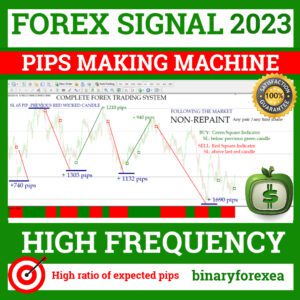
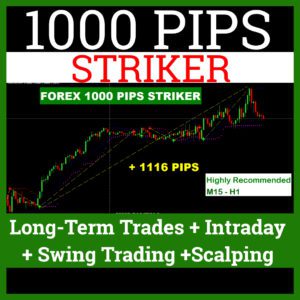
Forex signals are trade recommendations generated by experienced analysts or automated systems. Each signal typically includes the currency pair, direction (buy/sell), entry price, stop loss, and take profit levels.
How to follow signals effectively: Always set your stop loss before entering. Never risk more than 1-2% of your account per trade. Verify the signal aligns with your own analysis before entering. Use pending orders when the entry price hasn't been reached yet.
Our signal indicators display alerts directly on your MT4/MT5 chart with sound and push notifications, so you never miss a trading opportunity.
Manual trading gives you full control over every decision. You analyze the chart, decide when to enter and exit, and manage risk in real-time. This approach works best for traders who enjoy technical analysis and want to develop their own trading edge.
Automated trading (Expert Advisors) executes trades based on pre-programmed rules. It's ideal for removing emotions and trading 24/7, but requires proper setup and monitoring.
Many successful traders combine both: they use indicators and manual analysis for high-probability setups while running EAs on separate accounts for passive income. Our product catalog supports both approaches.
Major pairs (most liquid): EUR/USD, GBP/USD, USD/JPY, USD/CHF. These have the tightest spreads and most predictable technical patterns, making them ideal for manual traders using indicators.
Cross pairs: EUR/GBP, EUR/JPY, GBP/JPY. Higher volatility means bigger moves, but wider spreads. Good for swing trading strategies.
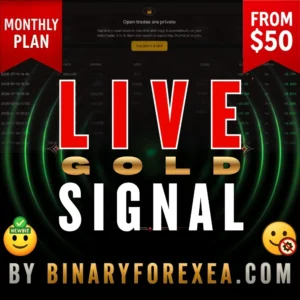
Gold (XAU/USD): Extremely popular but requires careful risk management due to high volatility. Use ECN accounts to minimize spread costs. Our Gold-specific indicators are calibrated for the unique behavior of precious metals.
The 1-2% rule: Never risk more than 1-2% of your total account balance on a single trade. If your account is $10,000, your maximum loss per trade should be $100-$200.
Use our free calculators: Our Lot Size Calculator helps you determine the exact position size based on your risk percentage, stop loss distance, and account size. Our Risk of Ruin Calculator shows the probability of blowing your account based on your current win rate and risk per trade.
Always set a stop loss: No matter how confident you are in a trade, unexpected news events or flash crashes can wipe out unprotected positions in seconds.
MT4: Download the .ex4 file → Open MT4 → File → Open Data Folder → MQL4 → Indicators → paste the file → restart MT4 → find it in Navigator → drag onto chart.
MT5: Download the .ex5 file → Open MT5 → File → Open Data Folder → MQL5 → Indicators → paste the file → restart MT5 → find it in Navigator → drag onto chart.
Configuring parameters: When you drag an indicator onto a chart, a settings window appears. Adjust the period, colors, and alert settings according to the product documentation. Most of our indicators include recommended settings for different timeframes and currency pairs.