
Forex Drawdown Calculator

Use this free forex drawdown calculator to see what a losing streak really does to your balance, because six bad trades in a row cost far more than most traders expect. Enter your starting balance, the number of consecutive losses and the risk you take on each trade, and you get the money left standing and the drawdown in percent.
What is a Drawdown Calculator?
A drawdown calculator is considered one of the most important risk calculators in a trader’s toolbox. One of the features of our drawdown calculator is allowing traders to accurately simulate what should be the ideal percentage of equity to risk per trade.
The use of this calculator can also help traders on avoiding reaching an uncomfortable percentage of drawdown that could, eventually, put the account equity at the risk of complete loss. For example, even using a moderate rate of 7% per trade, on a string of 10 consecutive losses, can wipe out more than 50% of the account’s initial capital.
We recommend traders to always use, and integrate, this drawdown calculator with any sound Money Management system or with an Account Equity Risk Management plan, before opening a trading position.
How to Use the Drawdown Calculator
Starting balance: This will be a trader’s initial account equity. Let’s say for example 1,000 units of any base currency.
Consecutive losses: In this field traders can simulate a streak of x consecutive losing trades. Let’s use, for our example, a series of 6 consecutive losing trades.
Loss % per trade: The crucial field of the drawdown calculator! As a rule of thumb, professional traders do not risk more than 2% of the account equity per trade. This proven methodology allows traders to last longer on their trading careers and, eventually, to recoup from previously losing trades. So, let’s use 2% per trade for our example.
Now, we hit the “Calculate” button.
The results: “The Ending Balance” after losing 6 consecutive trades and the “Total Loss” percentage.
In this case, an initial equity of 1,000 units of our account currency, after 6 consecutive losing trades, is now 885.84 units.
This means, even with only 6 consecutive losing trades (quite common in forex trading) and using a conservative, and recommended 2% risk per trade, the account balance has just lost 11.4%.
On the results above there’s a detailed breakdown of how each losing trade affected the account balance, how much each losing trade is in total percentage and the ending account balance.
Why the forex drawdown calculator matters more than your profit target
Almost everybody plans the upside first and the downside never. However, the drawdown decides whether you are still trading next month, so it deserves the first look and not the last one. That is exactly why this forex drawdown calculator sits right next to the lot size calculator in our toolbox.
Losses also refuse to add up in a straight line. Instead they compound against you, because each loss leaves a smaller balance for the next trade to work on. Risking 5 percent ten times in a row therefore does not cost 50 percent, it costs a little over 40 percent, and the account that survives has to climb much harder than you would guess. A drawdown is measured from the peak of the equity curve, never from your deposit.
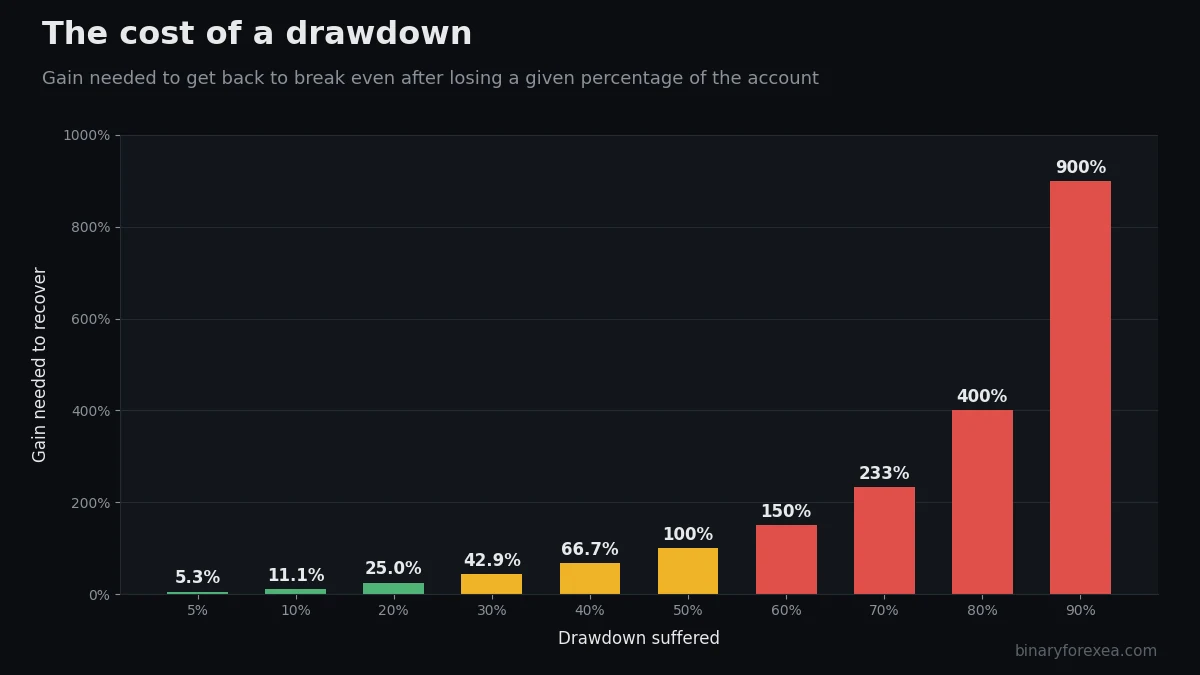

The recovery table that belongs next to every forex drawdown calculator result
Of course, here is the part that stings. After a drawdown you do not need the same percentage back, you need more, and the gap widens fast.
| Drawdown suffered | Gain needed to get back to even | What that means in practice |
|---|---|---|
| 5% | 5.3% | One decent trade |
| 10% | 11.1% | A normal week, nothing serious |
| 20% | 25.0% | A month of clean work |
| 30% | 42.9% | Now the pressure starts |
| 50% | 100% | You have to double the account |
| 70% | 233% | Almost nobody comes back from here |
So a 20 percent drawdown asks for a 25 percent gain, while a 50 percent drawdown asks you to double what is left. In other words, a small loss is an inconvenience and a deep one is a completely different job. Above all, notice how gentle the top of the table looks compared with the bottom.
How to use the forex drawdown calculator, field by field
- Starting balance. First of all, put in the equity you trade with today, not the amount you plan to deposit later.
- Consecutive losses. Choose the worst run you are willing to survive. Six is a realistic floor, while twelve is the kind of streak that reaches almost every strategy sooner or later.
- Loss percent per trade. This is the risk you fix before you enter, usually between 0.5 and 2 percent. Professionals keep it small precisely because of the table above.
Then read the two outputs together. The balance tells you what you can still trade with, and the percentage tells you how hard the comeback will be.
Forex drawdown calculator example: 2 percent risk against 5 percent risk
Take a 1,000 unit account and eight losing trades in a row, since that streak arrives for nearly every system eventually.
At 2 percent per trade the balance ends near 851, which is a drawdown of 14.9 percent, and a gain of 17.5 percent puts you back where you started. At 5 percent per trade the very same eight losses leave 663 on the account. That is a 33.7 percent drawdown, and now you need 50.7 percent just to be flat again. Same losing streak, same strategy, completely different outcome, and the only thing you changed was the risk box.
Once you have that number, check how likely the streak actually is with the risk of ruin calculator, and then look at the friendly side of compounding with the compounding calculator.
Forex drawdown calculator questions traders ask
What is a healthy maximum drawdown? Most prop firms cut you off between 5 and 10 percent, and most private traders start to break their own rules somewhere past 20 percent. Therefore, treat 20 percent as a ceiling rather than a target.
Does the forex drawdown calculator include swap and commission? No, because it works only on the risk you type in. Add roughly one extra losing trade to the streak if you hold positions overnight, because swap quietly eats the balance as well.
Why does my broker show a different drawdown? Brokers usually report the peak to valley move of your equity curve including open trades, while this calculator models closed losses only. Both numbers are correct, they simply answer different questions.
How do I keep the drawdown under control? Above all, fix the risk before the entry and let the position size follow the stop, never the other way round. The position size calculator does that arithmetic for you, and a mechanical exit such as the Hellhound trailing stop indicator keeps you from moving the stop once the trade is live.
FREE
USEFUL LINKS
WEEKLY NEWSLETTER
We Accept
© binaryforexea.com - Todos los derechos reservados
Premium Expert Advisors
Looking for more advanced EAs with updates and support?




Updated in September 2026