Risk of Ruin Calculator

Use this risk of ruin calculator to find the probability that a strategy destroys the account before it makes money. Type in the win rate, the average reward against risk and the percentage you put on each trade, and you get the peak to valley drawdown and the odds of reaching it.
What is a Risk of Ruin Calculator
The Risk of Ruin (RoR) is a mathematical model that can be used to calculate the chances of losing all of the account balance based on the win/loss % of a trading system and risk % used per trade.
For example, if a trader has a system that performs well with a 30% win rate, with an average profit factor of 2, and risking 2% per trade, this data can be added to the Risk of Ruin Calculator and used to develop an understanding of the overall robustness of the trading system. But the calculator can also be used to control the risk of ruin of the strategy and/or the peak-to-valley drawdown.
With this calculator traders can know the chances of blowing their trading account over time, with a particular trading strategy. This is based on the win rate percentage and the average risk percentage per trade. By entering the data of a trading system’s performance stats, and with the RoR calculator above, traders can easily calculate the risk of ruin of any trading strategy.
How to Use the Risk of Ruin Calculator
Win rate %: In this field traders should input the overall win rate percentage of the trading system. For example, let’s consider a current trading strategy that yields a 30% win rate.
Average profit/loss: In this field traders should enter the average profit earned per winning trade, divided by the average amount lost per losing trade. For our example we will use 2 as the average profit of our current strategy.
Risk per trade %: Countless times we’ve mention that as a rule of thumb, professional traders do not risk more than 2% of the account equity per trade. This professional methodology allows traders to stay on the markets longer and even to recoup the account equity lost with negative trades previously. So, we will use 2% as the risk per trade.
Number of trades: Very straightforward. If traders are testing a trading strategy and want to know how it will perform based on a number of future trades, then it’s only required to input the expected number of trades. It can be 30 daily trades, 15 weekly trades and so on.
If traders are testing a current trading strategy and want to know how it’s performing and it’s risk of ruin percentage, then just input the total number of trades taken so far. For this example, we will input 50 as the total number of trades for our current trading strategy.
Max drawdown %: In this field traders must input the maximal drawdown percentage reached (with a current trading strategy), or the expected maximal percentage if testing a new strategy. For our example, we will input a 30% maximal drawdown reached with our current trading strategy.
Next, we hit the “Calculate” button.
Reading the risk of ruin calculator results
The results: The first result is the Risk of peak-to-valley drawdown percentage, in our case 21.1%. Peak-to-valley drawdown definition is the largest cumulative percentage decline in portfolio value from a previous equity high. It is defined as the percentage decline from the trading account highest value (peak) to the lowest value (valley) after the peak. It can also be interpreted that, on our example, our trading strategy is showing a 21.1% probability of reaching 30% drawdown from an equity high to a subsequent equity low.
The second result of the calculator is the risk of ruin percentage of our trading strategy, in this case 13.7%- This means that our trading strategy is showing a 13.7% probability of reaching 30% drawdown of the starting equity amount.
Please note that the output of the Risk of Ruin Calculator can vary, because it is based on a simulation of 100,000 iterations.
What the risk of ruin calculator is really measuring
Two strategies can earn the same amount on paper and still end very differently, because the order of the wins and losses decides whether the account survives long enough to collect. The risk of ruin calculator measures precisely that danger.
In short, three inputs drive everything: how often you win, how much a winner pays compared with a loser, and how much of the balance each trade risks. Change any one of them and the answer moves dramatically, which is why guessing is a bad idea here.
Risk of ruin calculator numbers from twenty thousand simulated accounts
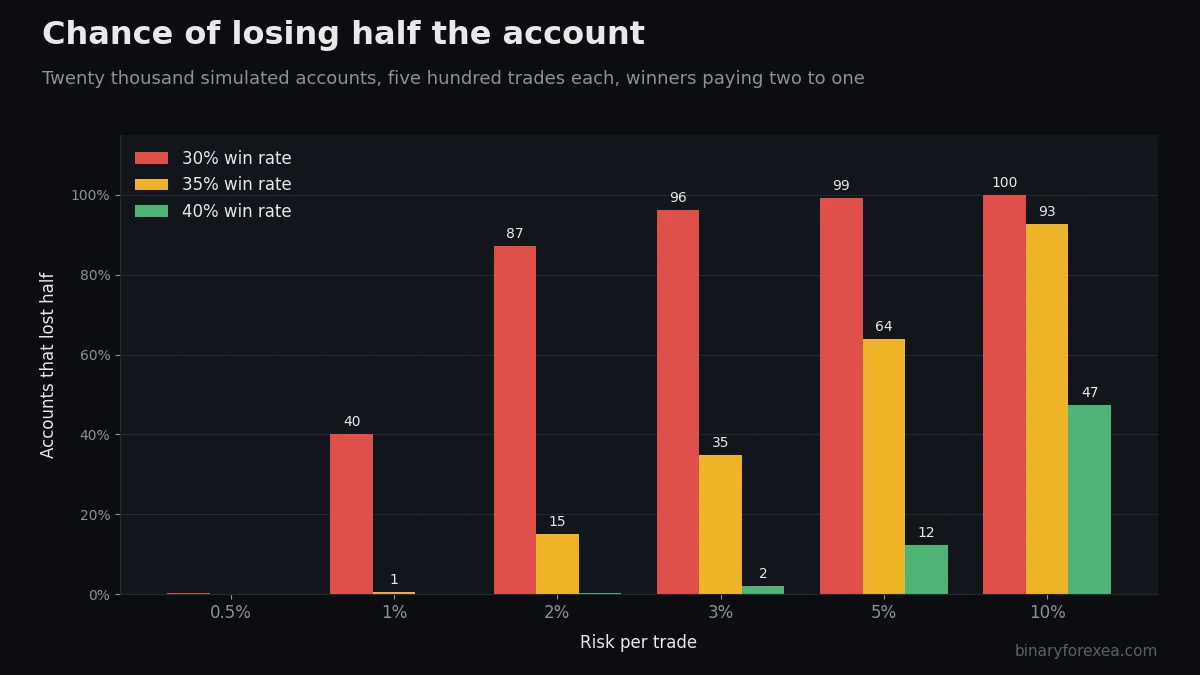
Of course, we ran the experiment ourselves rather than quoting somebody else. Twenty thousand accounts, five hundred trades each, winners paying twice what losers cost, and ruin defined as losing half the balance. Finally, these are the results.
| Risk per trade | 30% win rate | 35% win rate | 40% win rate |
|---|---|---|---|
| 0.5% | 0.2% | 0.0% | 0.0% |
| 1% | 40.0% | 0.6% | 0.0% |
| 2% | 87.3% | 15.1% | 0.2% |
| 3% | 96.2% | 34.8% | 2.0% |
| 5% | 99.3% | 63.8% | 12.2% |
| 10% | 100.0% | 92.8% | 47.3% |
Above all, read the first column carefully. At two to one, a 30 percent win rate has no edge at all, so risking less does not save the account, it merely postpones the funeral. Conversely, the other columns tell the opposite story: with a real edge, the risk per trade is the only thing standing between a good strategy and a dead one.

The line the risk of ruin calculator keeps drawing
For example, notice what happens between 1 percent and 5 percent at a 35 percent win rate. Indeed, the chance of ruin climbs from under one in a hundred to nearly two in three, and absolutely nothing about the strategy changed. Instead, only the size of the bet changed.
Therefore the professional habit of risking 1 percent is not timidity, it is arithmetic. Fix the percentage, let the lot size calculator translate it into volume, and check the survivable losing streak in the drawdown calculator.
How to use the risk of ruin calculator on your own numbers
- Win rate. First, take it from your last hundred closed trades, not from your best month.
- Average profit against average loss. Then divide the mean winner by the mean loser. Most discretionary traders find this closer to 1.2 than to the 3 they imagined.
- Risk per trade. Finally, use what you really risked, including the trades where you moved the stop.
If the honest numbers give an uncomfortable answer, then the fix is rarely a new strategy. Usually it is a smaller percentage, because that single change moves the result more than anything else on the page. The idea comes from gambling mathematics, and risk of ruin works the same way in both worlds.
Risk of ruin calculator questions traders ask
Why does the result change every time I run it? Because it is a simulation of random orderings, so small differences are normal. The pattern stays the same even though the last decimal moves.
Does a high win rate make me safe? Not on its own. For instance, a 90 percent win rate with losers ten times the size of winners still ruins the account, and quickly.
What counts as ruin? Basically, whatever ends your trading. For a prop account that is often 10 percent, while for a private account it is usually the drawdown at which you stop following your own rules.
Can I just trade smaller after losses? Certainly that helps survival, although it also slows recovery. Above all, it does not create an edge where there was none, as the first column of the table shows.
FREE
USEFUL LINKS
WEEKLY NEWSLETTER
We Accept
© binaryforexea.com - Todos los derechos reservados
Premium Expert Advisors
Looking for more advanced EAs with updates and support?



Updated in September 2026