Backdraft, the dynamic support resistance MT4 indicator that trades the breathing of a trend
A trend never travels in one straight push. It runs, it leans back onto the same invisible floor, and it runs again. That floor moves with the market, which is why a horizontal line never catches it. Backdraft is a dynamic support resistance MT4 indicator that draws the moving floor on your chart and fires when price dips into it and gets thrown back out.
The arrow does not repaint, does not move and does not disappear. It needs a closed candle, and once it prints it stays exactly where it printed.
 Click the image to enlarge
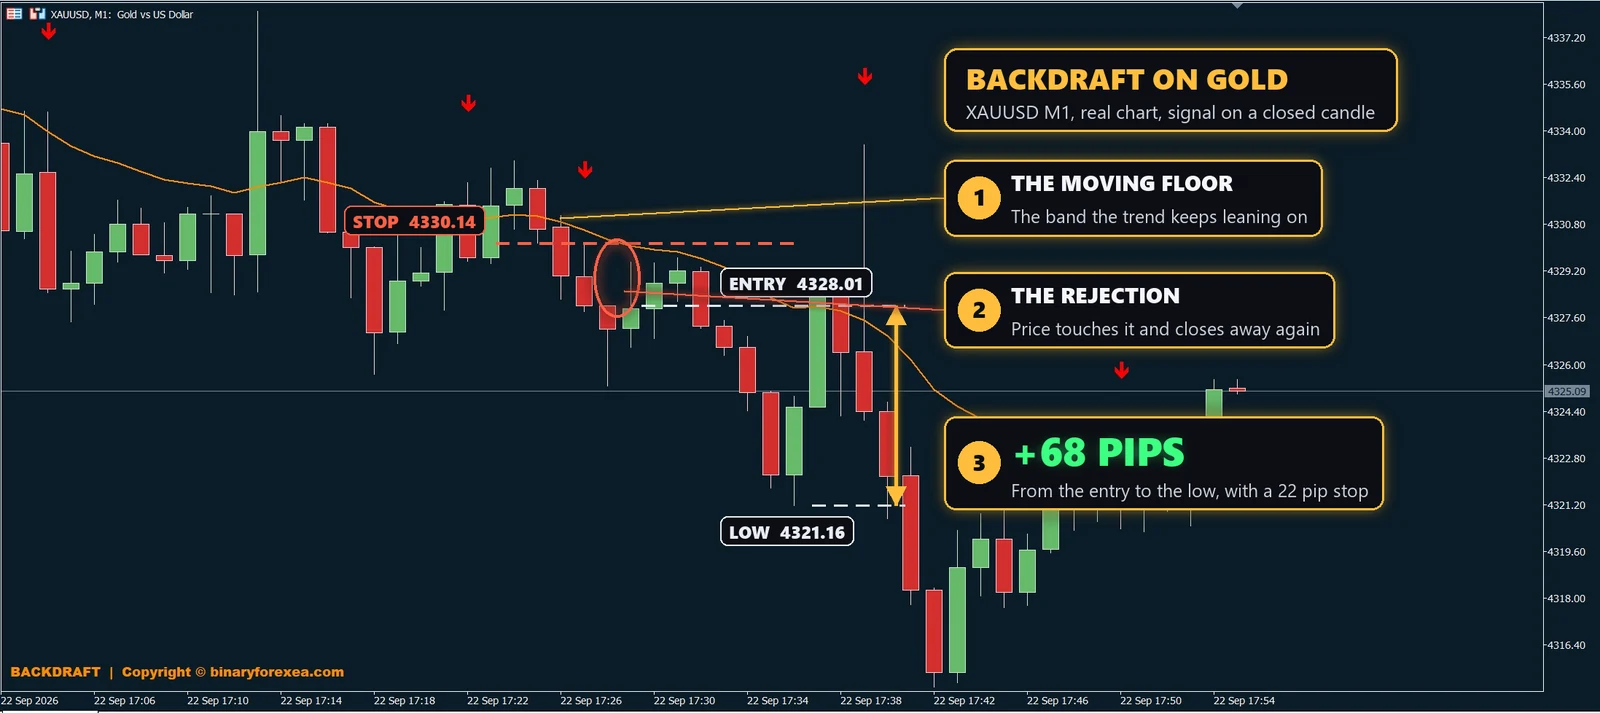
Real chart, gold on M1. The orange band is the moving ceiling of a falling market. First price climbs into it. Then it leaves a wick above the band and closes back under. The sell arrow prints at 4328.01 with the stop on the tip of that wick at 4330.14, a risk of only 22 pips. From there gold dropped to 4321.16, a move of 68 pips, three times the risk. Every price comes from the exact candle history of that chart.
Why a moving line beats a fixed one
Horizontal levels are made by the past. A trend, however, makes new prices every hour, so the place where buyers step in keeps rising with it. Therefore the useful floor is a line that travels, and the best trades of any trend happen when price taps it and refuses to stay there.
As a result this tool does two things at once. First it decides which side the market is on, using a slower reference. Then it only accepts touches on that side, so you never buy the dip of a market that is falling apart.
What this dynamic support resistance MT4 indicator checks
- The side. The slower reference has to be sloping, with price on the correct side of it.
- The touch. Then the candle has to reach the moving band, and not merely get near it.
- The rejection. After that, a real wick has to point at the band.
- The close. Finally, the candle closes away from the band, in the direction of the trend.
Besides, a gap between signals on the same side keeps three arrows from stacking on the same pullback.
How to trade the signals
- Enter on the close of the arrow candle. By then the rejection is complete.
- Stop on the tip of the wick. That is exactly why the risk on these trades stays so small.
- Target the last extreme of the trend. Alternatively, trail as long as price respects the band.
- Stop trading when the band flattens. Also, a flat band means there is no trend to lean on.
Markets and timeframes
| Gold XAUUSD | M1, the example above |
| EURUSD and the majors | M5 to H1 |
| All major pairs | M1 to H1, the same rules |
Gold on M1 gives the fastest version of this idea, and for that reason it delivers many small trades per session. In practice, M15 and H1 turn the same rules into swing entries.
What is inside
- The moving band drawn as a line across the chart.
- Arrows on closed candles only. They do not repaint, move or disappear.
- Editable band length, trend length, touch depth and wick share.
- Popup, sound, push and email alerts, each one switchable.
- Premium dark chart theme, applied on attach and restored on remove.
Besides, it reads price only, so any broker and any account works. If you want robots that trade by themselves, browse our automated robots, and the rest of the manual set is in our chart tools for traders.
Questions about this dynamic support resistance MT4 indicator
Does it repaint? No. The band is built from closed candles and the arrow needs a closed candle as well.
Why did it skip an obvious touch? Because the trend filter did not allow that side. Otherwise, the candle had no rejection wick.
Is this just support and resistance in motion? Yes, that is exactly the idea, with a fixed rule for the entry and the stop.
Do you have the other version? Yes. This is the MetaTrader 4 build, and Backdraft for MT5 draws the same band on MetaTrader 4.
Trading involves risk. Signals are information, not advice, so try any new tool on a demo account first and only trade money you can afford to lose.