


GO TREND MULTI-TIMEFRAME
The “GoTrend Multi-Timeframe” indicator is an essential tool for traders looking for a quick and efficient way to assess the overall and specific trends of a currency pair across different timeframes.
This indicator allows traders to gain a clear and comprehensive view of market direction at a glance, optimizing decision-making and enhancing the effectiveness of their trading strategies.
Main Features:
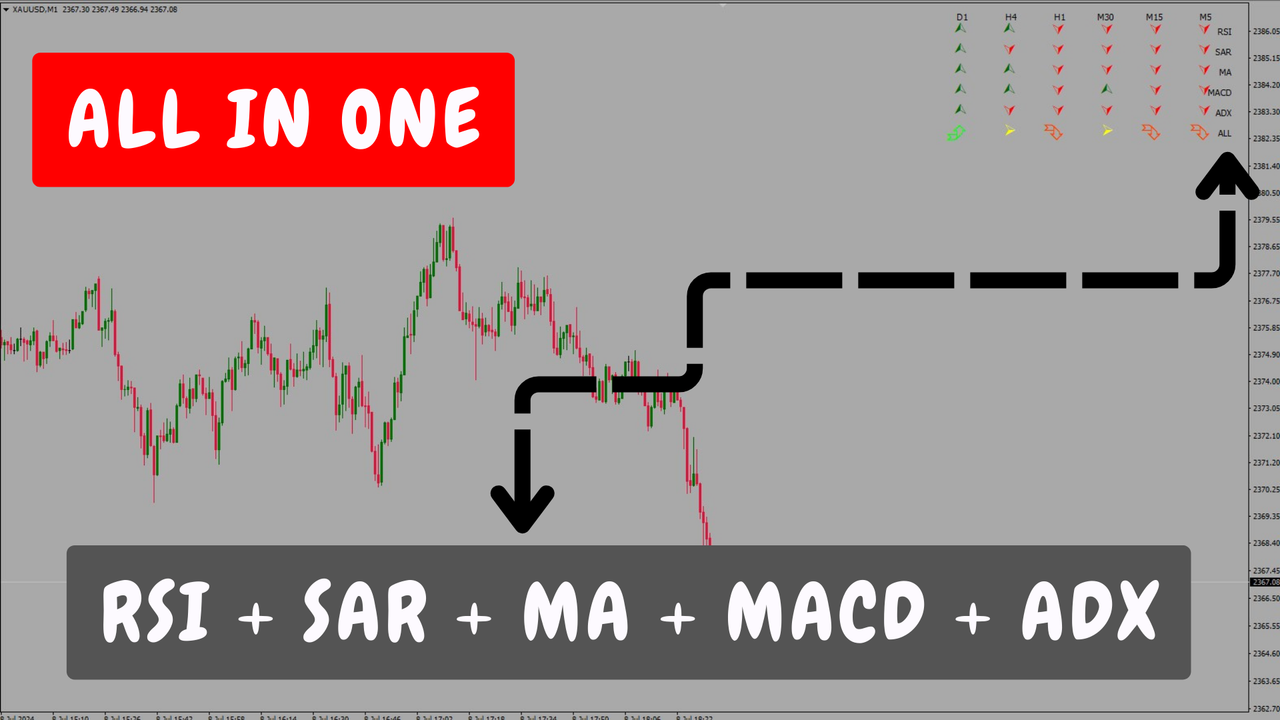
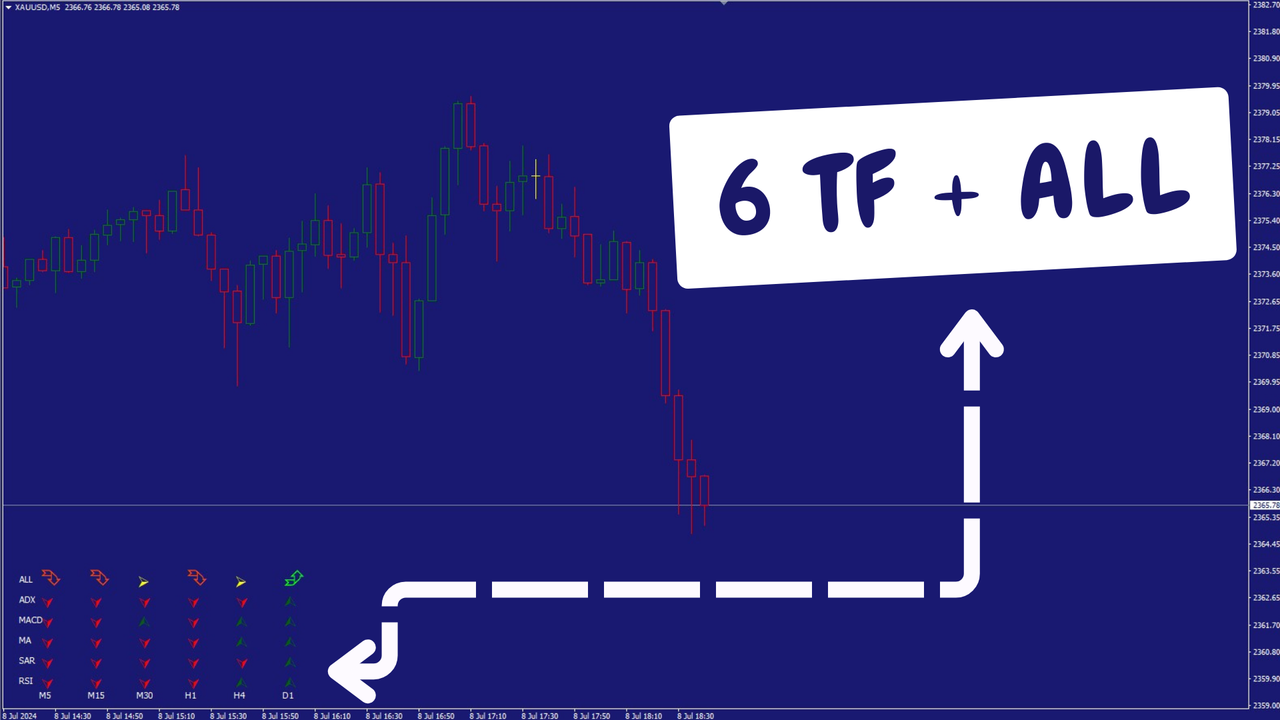
- Multi-Timeframe Analysis: This indicator provides an exhaustive analysis of six different timeframes: M5, M15, M30, H1, H4, and D1, allowing traders to understand the trend in each of these periods.
- Integrated Technical Indicators: The indicator uses five robust technical indicators: RSI, SAR, MA, MACD, and ADX, to determine trend direction in each timeframe.
- Clear and Intuitive Visualization: Signals are displayed in the corner of your choice on the main chart with intuitive symbols and colors. This allows traders to evaluate the market situation at a glance.
- Combined Signal: In addition to individual signals from each indicator, the “GoTrend Multi-Timeframe” offers a combined signal summarizing the overall market trend for that pair.
Trading Benefits:
- Quick and Clear Trend Overview: With this indicator, traders can obtain a quick and clear view of the trend direction across multiple timeframes, which is crucial for making informed and timely decisions.
- Optimization of Entries and Exits: Buy and sell signals in different timeframes help traders optimize their entry and exit points, increasing the likelihood of success in their trades.
- Reduction of Market Noise: By focusing on trend signals from multiple timeframes, traders can filter out market noise and avoid false entries, thereby improving risk management.
- Ease of Use: The indicator setup is simple, and results are displayed clearly, making it easy to use even for beginner traders.
Using the Indicator:
- Trend Assessment: Before making a trading decision, traders can check the trend in the six different timeframes. If most timeframes show a buy or sell signal, this provides solid confirmation of market direction.
- Entry and Exit Strategy: Use individual signals to identify optimal entry and exit points. For example, a buy signal across multiple timeframes may indicate a good time to enter a long position.
- Trade Management: The “ALL” combined signal offers an overall view of the trend for that pair, helping traders maintain their positions in the right direction of the trend or open new trades in the same direction as the general trend.
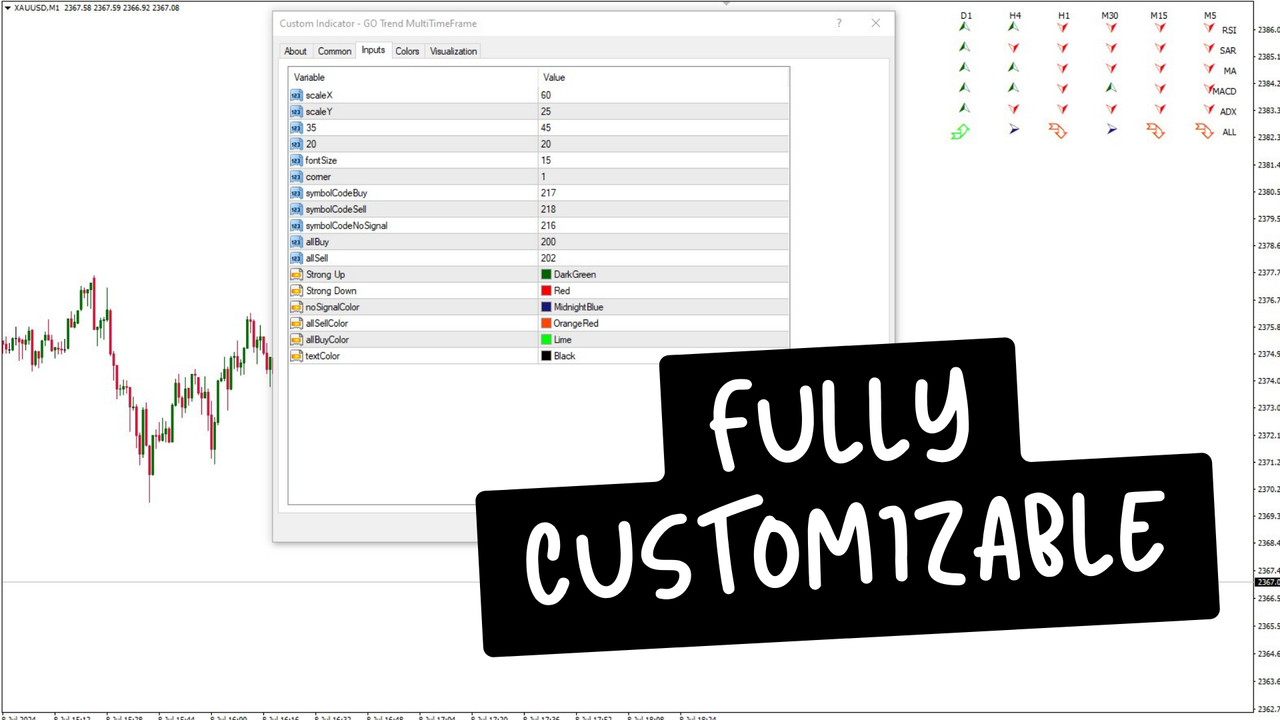
Indicator Settings:
- Position on Chart: The indicator is displayed in the corner of the main chart with customizable settings for spacing and symbol size.
- Customizable Colors: The colors of “buy,” “sell,” and “no signal” signals are customizable to suit the trader’s visual preferences.
Limitation of Alarms:
This indicator does not have and cannot have alarms due to its flexible design that adapts to all types of trading. This includes trading in a single timeframe, across timeframes, or using a higher timeframe to determine the trend and then looking for entries in lower timeframes. Fixed alarms would not be suitable for the versatile and adaptive nature of the “GoTrend Multi-Timeframe.”
The “GoTrend Multi-Timeframe” is the perfect ally for any trader looking to streamline their decision-making and optimize their trades. With clear visualization and deep trend analysis across multiple timeframes, this indicator provides the necessary information for a quicker understanding of the pair’s situation and, consequently, more accurate trading decisions.
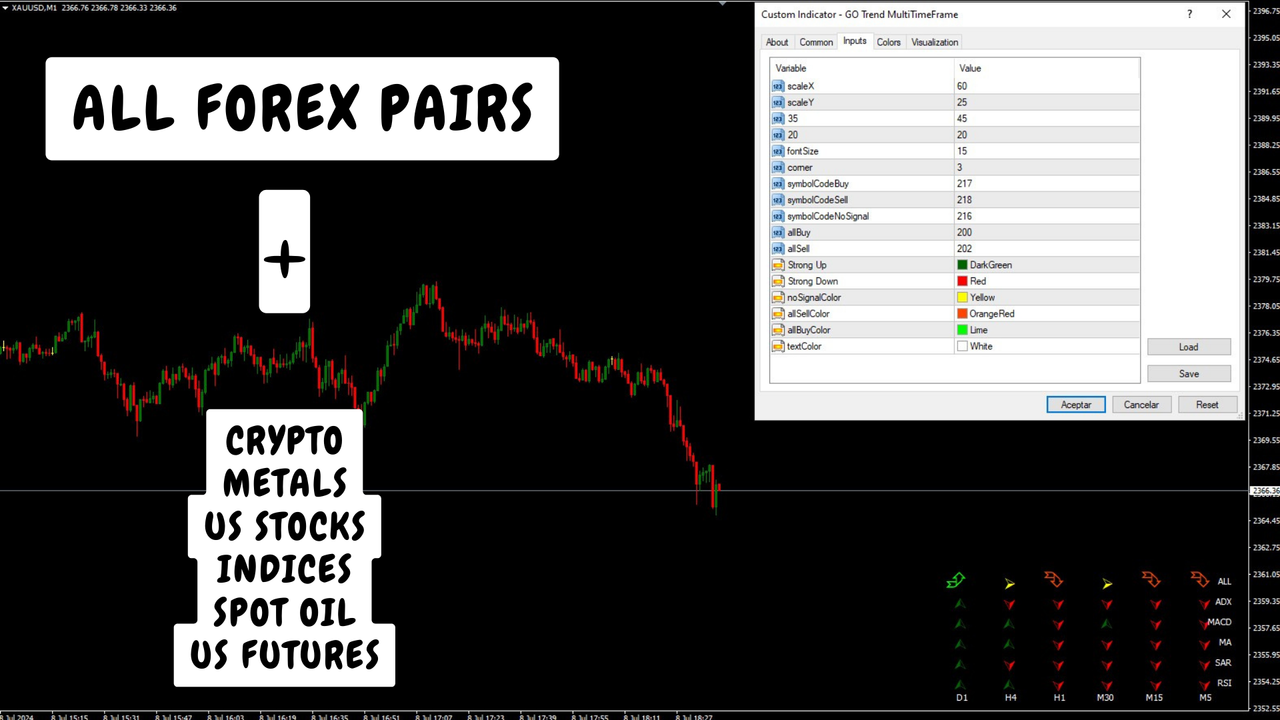
Description of Input Parameters:
- scaleX (Value: 60): Defines the horizontal distance between signals displayed on the chart. This value adjusts the space between icons for clear and organized visualization.
- scaleY (Value: 25): Defines the vertical distance between signals displayed on the chart. This value adjusts the space between icons to avoid overlap and ensure easy reading.
- offSetX (Value: 45): Sets the horizontal distance from the left edge of the chart to the first signal icon. Allows positioning signals in the desired place on the chart.
- offSetY (Value: 20): Sets the vertical distance from the top edge of the chart to the first signal icon. Allows positioning signals in the desired place on the chart.
- fontSize (Value: 15): Font size of the signal icons. This value determines how large or small the icons will appear on the chart.
- corner (Value: 2): Defines which corner of the chart the signals will be positioned in. The values can be:
- 0: Top left corner
- 1: Top right corner
- 2: Bottom left corner
- 3: Bottom right corner
- symbolCodeBuy (Value: 217): Code of the symbol representing a buy signal. This code corresponds to a specific character in the “Wingdings” font.
- symbolCodeSell (Value: 218): Code of the symbol representing a sell signal. This code corresponds to a specific character in the “Wingdings” font.
- symbolCodeNoSignal (Value: 216): Code of the symbol representing no signal. This code corresponds to a specific character in the “Wingdings” font.
- allBuy (Value: 200): Code of the symbol representing a combined buy signal. This code corresponds to a specific character in the “Wingdings” font.
- allSell (Value: 202): Code of the symbol representing a combined sell signal. This code corresponds to a specific character in the “Wingdings” font.
Signal Colors:
- signalBuyColor (Strong Up) – (Color: DarkGreen): Color of the symbol indicating a strong buy signal.
- signalSellColor (Strong Down) – (Color: Red): Color of the symbol indicating a strong sell signal.
- noSignalColor (No Signal) – (Color: Goldenrod): Color of the symbol indicating no signal.
- allSellColor (Color: OrangeRed): Color of the symbol indicating a combined sell signal.
- allBuyColor (Color: Lime): Color of the symbol indicating a combined buy signal.
- textColor (Color: Black): Color of the text describing time periods (M5, M15, M30, H1, H4, D1) and indicator names (RSI, SAR, MA, MACD, ADX, ALL).