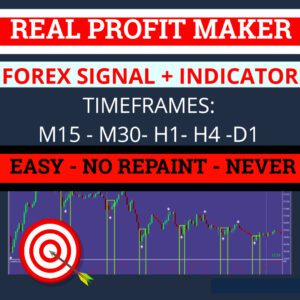

MACD 2 LINE INDICATOR MT4
- MACD 2Line for MT4 generates technical analysis signals for trading based on moving averages and the volume histogram.
Contents:
- Description
2. Features
3. Trading signals (alerts)
4. Settings - Description MACD2Line

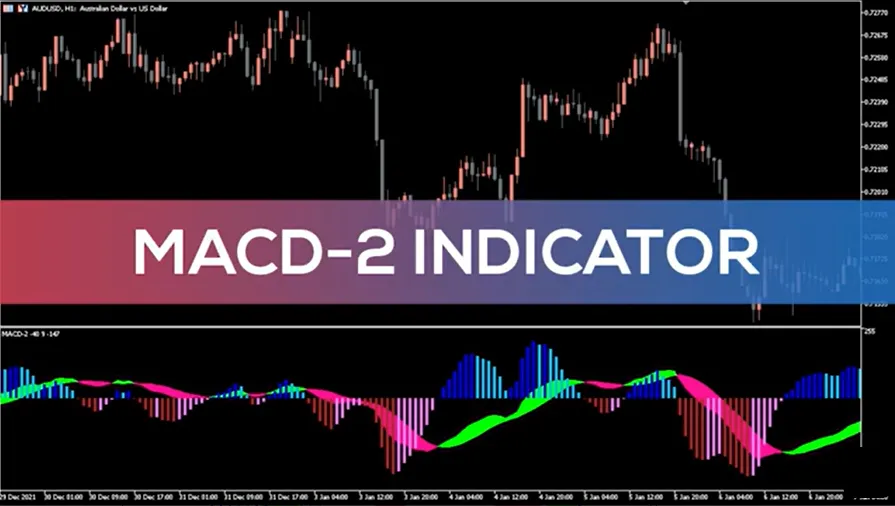
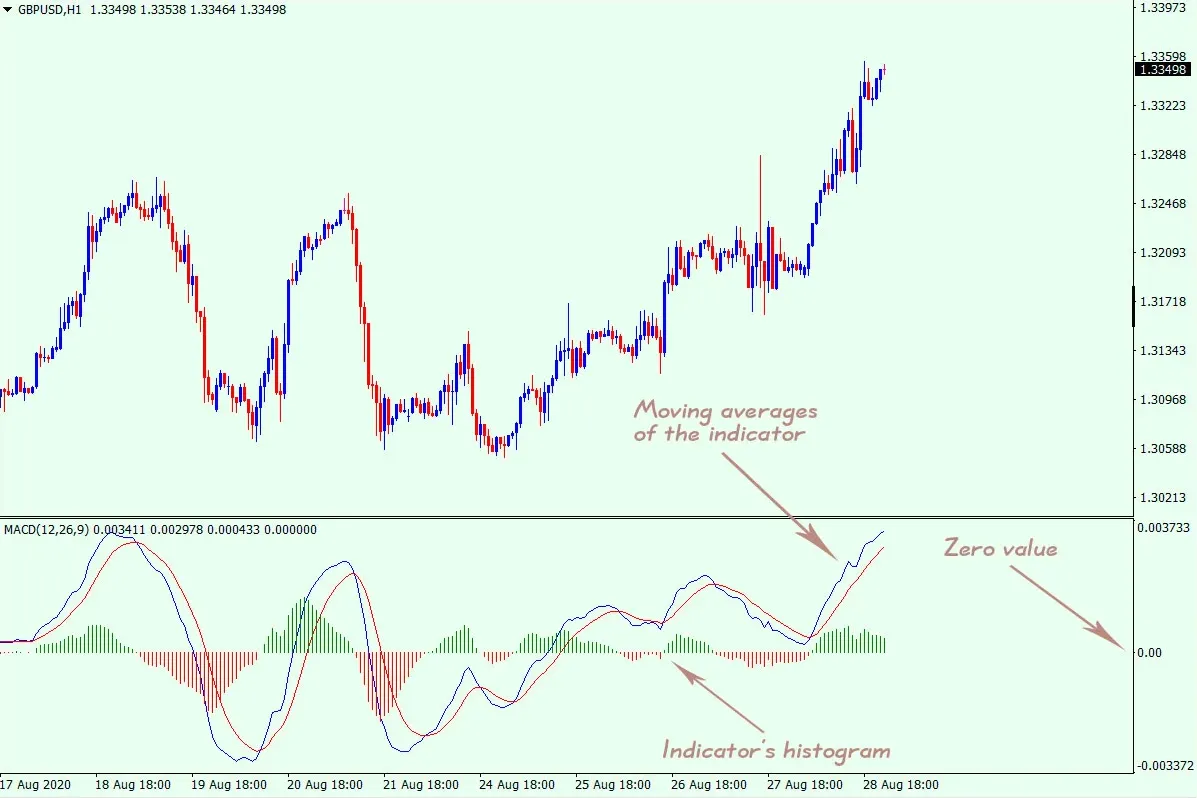
- The MACD 2 Line indicator draws moving averages (Exponential Moving Average, EMA) and volume histogram in a separate window of the chart.
The indicator has a zero line as well. The entire space above the line is an overbought zone, while that below it is an oversold zone.
- The higher the moving averages are above the zero line, the more likely it’s that the trend will reverse downwards. If the EMA is below the zero line, the higher the odds of reversing the trend upwards.
- By default, the MACD2Line belongs to the group of oscillators. Therefore, one would better use the indicator when the global trend and the smaller trends change to the opposite ones.
No matter which trading approach you’re using – swing, intraday or long-term trading – the indicator can be a nifty complement to your trading system.
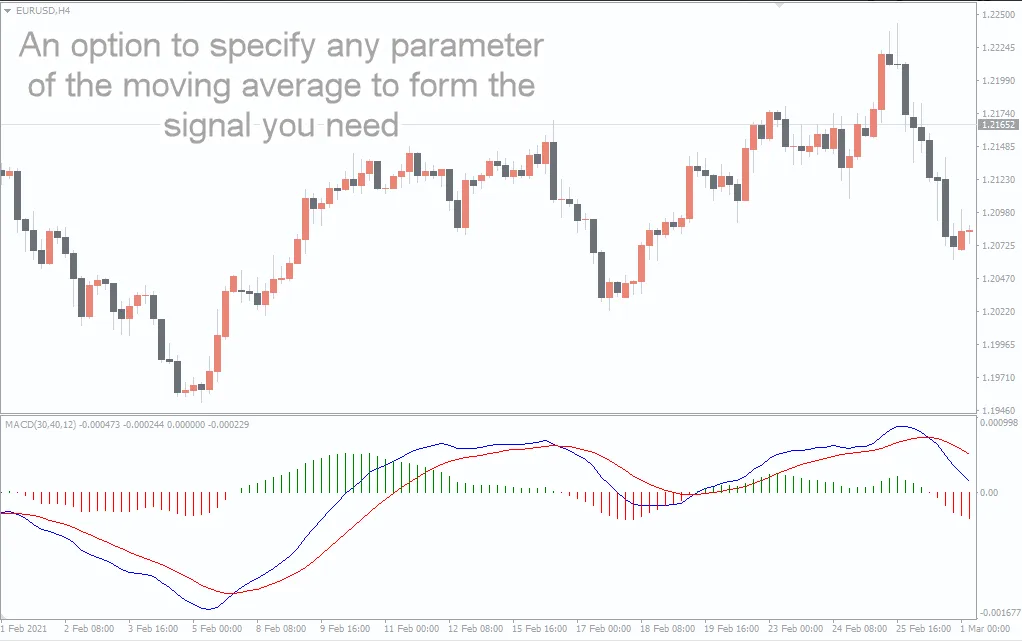
So, if you follow intraday and swing trading techniques and prefer smaller periods of EMA, the number of entry points will grow. Accordingly, the odds of opening profitable trades during reversals of short-term trends will be also higher.
If you prefer holding your positions open in the medium and long term, while increasing the periods of moving averages, you’ll get fewer entry points. But they can be more reliable!
- Features MACD2Line

- By default, MT4 has the in-built MACD indicator, which is the predecessor of the MACD2Line that has a number of advantages over the standard MACD:
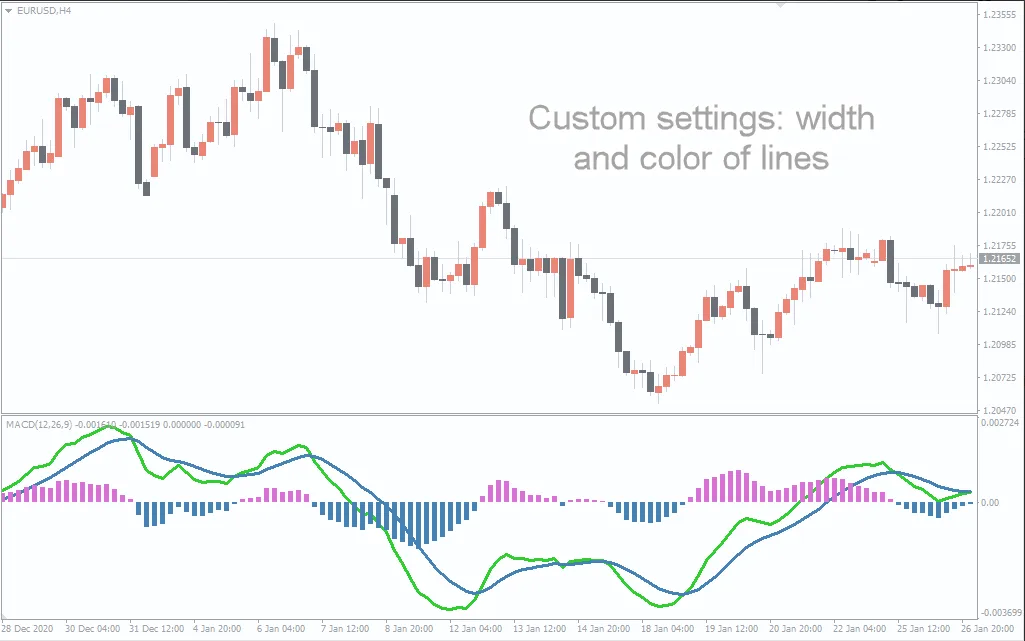
- First, the indicator draws two moving averages –the fast EMA and the slow EMA. Both these lines are of different colors: the fast one is blue, and the slow one is red. Entry signals are generated when the fast line crosses the slow one.
- Second, the histogram volumes have two colors as well – red and green. If the volume color is red, only selling should be considered; if the volume color is green, you should consider buying only.
- Third, the zero line of the indicator can serve as a more effective additional signal for trading rather than that of the standard MACD.
While the MACD has a common volume histogram and one EMA, the MACD 2 Line divides the indicator’s histogram volumes into bullish and bearish ones. And the second moving average provides a larger number of prospective entry points for trading.
- Trading signals (alerts)
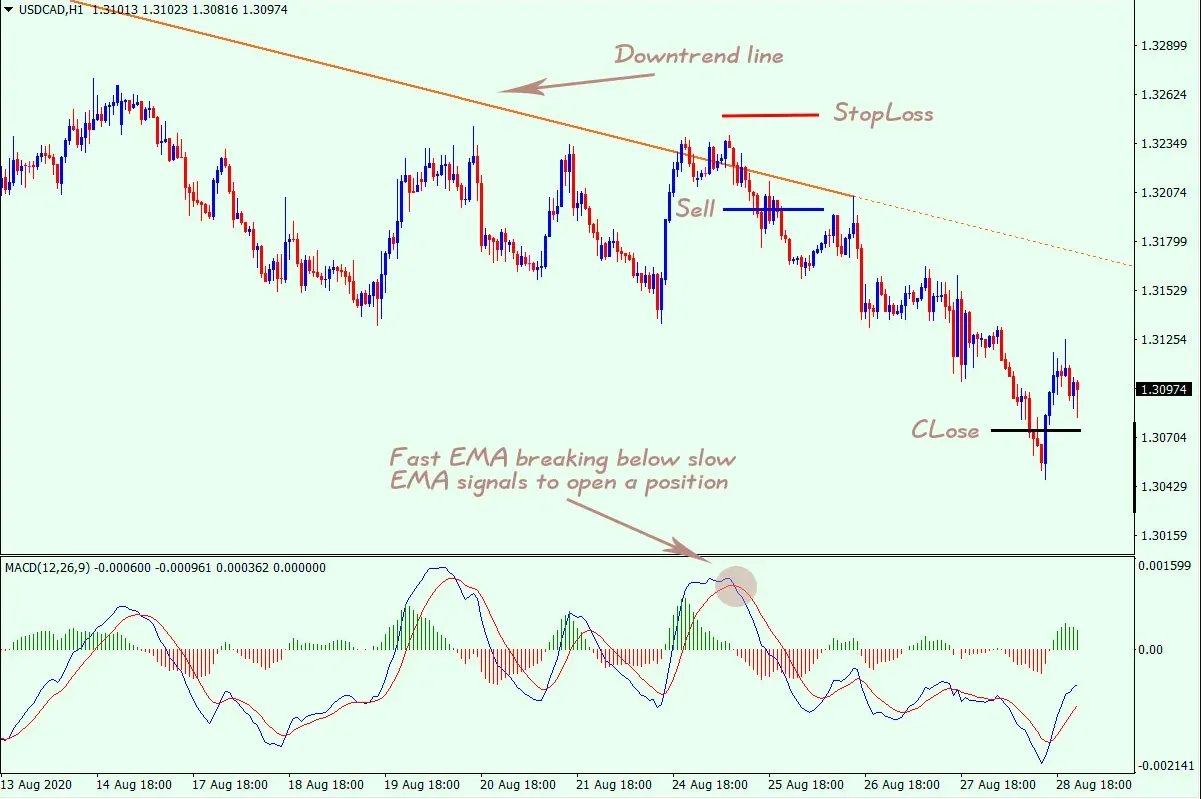
Although the indicator generates bearish and bullish signals, we should use one of the main tools of technical analysis – the trendline – to enhance the reliability of entry points.

- As seen in the above example, several factors indicate a bearish signal. The EMA is in the overbought zone, the volume histogram is colored red, and there is a Sell entry point formed by crossing the slow moving average by the fast one.
Take a look at the downtrend line acting as a secondary indicator. Until it’s not broken above, we can see the global bearish trend, and therefore we should only consider Sell trades.
- It would be safer to set Stop Loss for a prospective trade beyond the trendline, and closing a position would be better at the time when the EMA shows the near-maximum oversold readings (values).
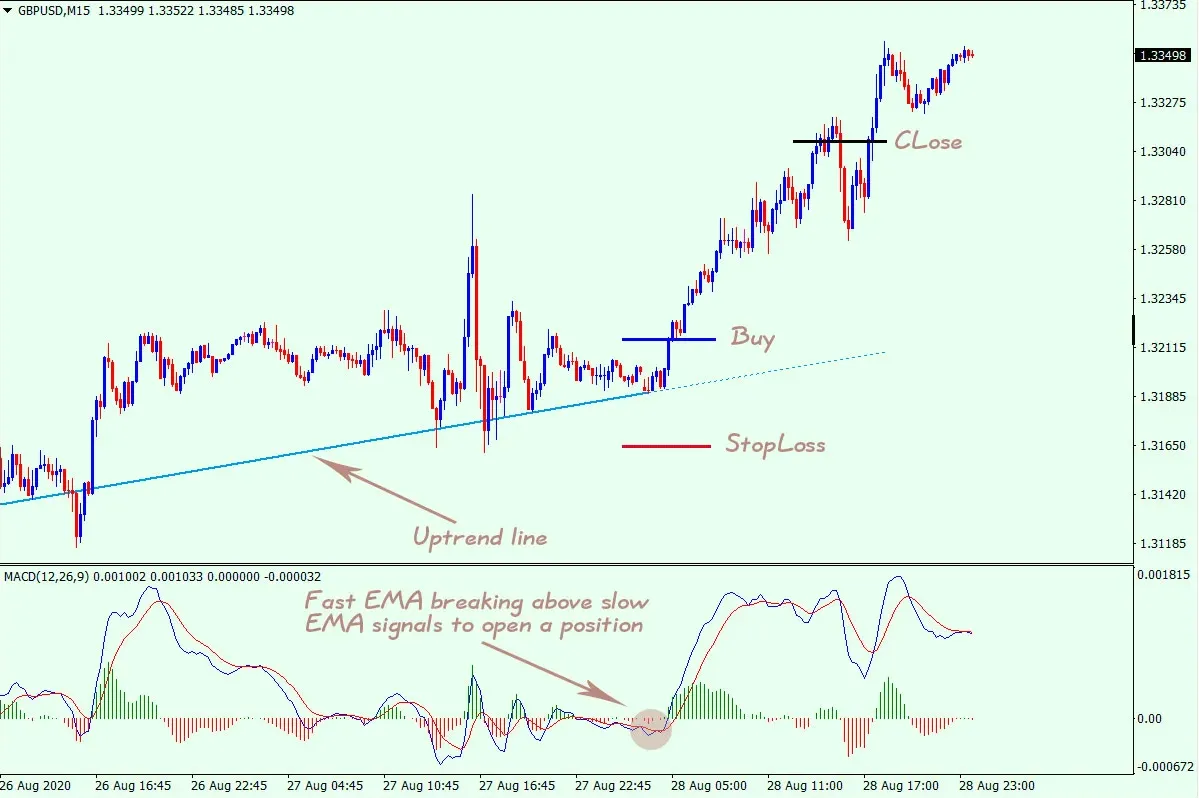
- To illustrate how to use the MACD2Line indicator on different timeframes, we’re going to analyze a Buy trade on the M15 timeframe.

- As in the above example of selling, the uptrend line serves here as an additional technical analysis tool: we should look for buying opportunities only until it’s broken below.
The above chart shows a buying-friendly conditions made up of the combination of the green histogram volumes, the bullish trendlines, and the signal. It generated by a crossover of the moving averages.
Stop Loss for a prospective trade should be placed beyond the trendline, and position can be closed after hitting the maximum overbought readings.