


CANDLE PATTERNS INDICATOR MT4
- Candle patterns indicator are favorites for price action traders. There are numerous candlesticks patterns in the forex market, categorized as bearish and bullying candle patterns. The candle patterns usually consist of one or more candles. Some common candlesticks include the Doji, pin bar, evening star, hammer, morning star, shooting stars, engulfing pattern, harami, and piercing line.
Depending on where they appear on the market, the patterns signify a trend reversal or continuation. Thus, being well versed with candlestick formation helps traders predict the likely market direction.
- If you have studied these patterns for a long time, you can easily identify them with naked eyes. But it can be quite a tasking task moving from one bar to another trying to identify the candle pattern.
The indicator detects the candlesticks, displays the alert notification. Additionally, An arrow points at the specific candlestick.
- Using the indicator helps traders take advantage of trading opportunities. For instance, if there is a likely reversal or potential breakout, you can adjust your positions accordingly. In addition, the candle pattern indicator can be used in all time frames and currency pairs.
How the Candlestick Pattern Indicator Functions
- Using the candle pattern indicator is relatively easy. All you need to do is mount the indicator on the price chart, and it will do the rest. The indicator allows you to choose the patterns and tweak notification settings. Once you set the preferred settings, the indicator will scan the chart and mark the popular candle patterns.
- If the arrow appears on top of the candlestick, it signifies a bearish candle pattern. Conversely, an arrow under the candlestick indicates the candlestick is bullish.
- The best part is that you don’t have to struggle to identify the name of the candlestick. The indicator helps you in three significant ways. First, it helps you establish the entry signal, exit signals and set the trailing stops.
- Remember, not every candle pattern qualifies for trade entry. This means you should only trade the bullish candle pattern in an uptrend. For a downtrend, only a bearish candlestick will suffice. What’s more, you will want to consider only the candle pattern that appears on resistance and support zones.
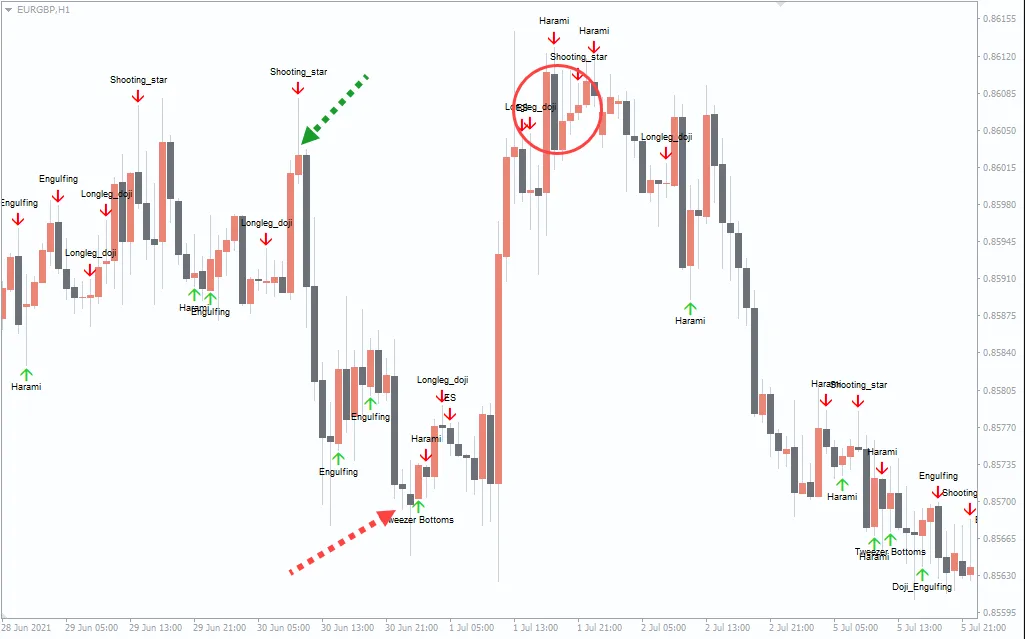
Chart Example


- The chart above shows the price movement for Euro against the British Pound pair in a one-hour timeframe. The candle pattern indicator scans the price chart and pinpoints the candle patterns. For instance, the green arrow points at a shooting star. Remember when the shooting star from resistance level or a new high, It is a telltale signal potential reversal. In fact, the EUR/GBP falls sharply after the candle pattern.
Also, notice the Doji pointed by the red arrow, which forms at the support level. After some time, the price rises significantly. Similarly, the circle points at a hammer pattern. Since the pattern occurs in a resistance zone, it is a signal of a potential market reversal. Again, the price falls after testing the resistance levels severally.
Conclusion
- Candle patterns are some of the powerful tools for technical analysts who fancy price action strategy. But you do not have to go through the charts trying to identify the candle patterns. Instead, the chart pattern indicator identifies and names all the popular candle patterns to enhance your trading results. In general, a candlestick chart pattern is an excellent technical analysis tool.