ENGULFING INDICATOR MT4
- Engulfing Indicator is highly accurate and easy to use. A perfect trend reversal detector.
If you are a technical forex trader, you have probably come across the term engulfing pattern (eng-pattern). If you have not, do not fret. As the name implies, the eng-pattern occurs when one candlestick completely covers the previous candlestick. Essentially, the pattern is a sign of possible trade reversal and appears in the overall or counter-trends.
- The Engulfing Indicator for MT4 –scans the market and identifies the engulfing patterns in the chart. This means that you do not have to do the donkey work of manually identifying the pattern. In fact, the indicator goes a step further to differentiate the bearish engulfing and bullish c and labels them accordingly.
Therefore the Engulfing Indicator is suitable for both beginners and advanced traders. The best part is that you can use the indicator in all currency pairs and timeframes. Also, the indicator allows you to tweak the settings to fit your personal preferences.
Using the Engulfing Indicator for Trading
- Essentially, the eng-patterns show where the market pressure is concentrated. To be specific, the bullish engulfing shows the buying pressure is dominating the market. In other words, the buyers are more than the sellers and hence pushing the prices up. When the sellers are more than buyers, they push the price lower.
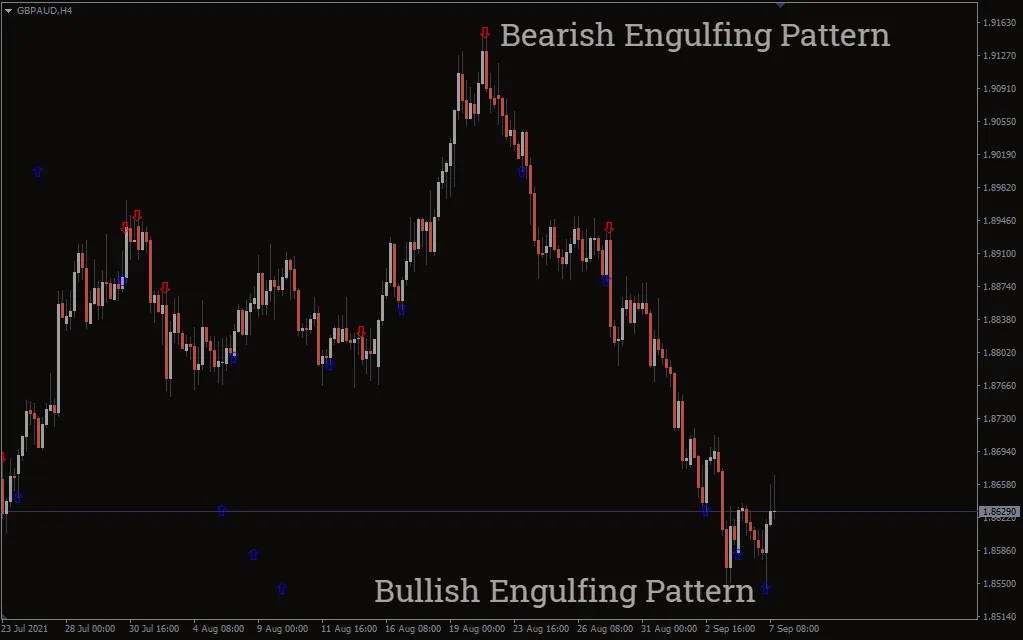
- The indicator posts an upward-pointing blue arrow when it identifies a bullish eng-pattern and a red arrow pointing downward when it detects a bearish engulfing pattern. Therefore, your work is to identify the arrows and trade accordingly. However, it is prudent to use other confirmation filters like trend lines and moving averages to support the signal.
- In addition, the indicator works best in resistance and support areas. Put differently, the signal is strong when the blue arrow (bullish engulfing) appears on the resistance areas, and the red arrow appears on the support area.

- The chart above shows price movement for the Great Britain pound against the Australian dollar. Indicator scans the chart and detects engulfing chart patterns. For instance, the indicators post a red arrow indicating the engulfing pattern is bearish. Notice how the pattern (shown by the arrow) forms after a double touch. This makes the pattern a high probability signal. In fact, the markets undergo strong bearish movement after the signal. Currently, the market has formed a bullish engulfing pattern in new lows. The blue arrows indicate a suitable place to enter a long position.
Conclusion
- The engulfing pattern is one of the most popular profitable candlesticks patterns. The Engulfing Indicator relieves the trader of the hard work of identifying the pattern on the chart. It also directs investors whether to buy or sell by posting bullish and bearish arrows. You simply mount the indicator on the chart, and it will identify the patterns for you. All you need to do is trade accordingly, and profits start to trickle in. Like most indicators, you should use other tools for confirmation.


