


KELTNER CHANEL INDICATOR MT4
- A technical indicator consisting of two bands above and below the moving average of the price indicator, the width of which is determined as a fraction of the average price change for the period. The author of this method is Chester W. Keltner (1909-1998), who published it in his book “How To Make Money in Commodities” in 1960.
Have you been having trouble figuring out what the current market trend is? Maybe you have heard the phrase “always trade with the trend” multiple times, but you don’t even know when the market is in an uptrend or a downtrend. What you need is the Keltner channel (KC) indicator for MT4.
The Keltner Channel Indicator On MT4


- The Keltner channel indicator is made up of three bands on the MT4 platform, with two serving as the upper and lower bands. The third band stays in the middle of the other two lines. Depending on the settings used for the indicator, price usually moves back and forth within the bands.
There are many advantages to using this indicator.
- One of the most common uses of the Keltner channel is to determine market trends. When the channel is upturned, it signifies an uptrend. And when it is downturned, it signifies a downtrend.
- Not only does the Keltner channel spot major trends seamlessly, but it can also be used to spot true potential trend reversals.
The Keltner channel has rival indicators that do most of what it does. One close rival is the Bollinger Bands indicator.
But the advantage of the Keltner channel over these rival indicators dwells in its calculation formula. And because of this formula, the indicator, at its default setting, does not react too closely to the market. The result is the indicator’s bigger resistance to false breakout signals. A trader may alter the settings to make the channel react quicker or slower to the market.
How Is Indicator Calculated?
The KC indicator uses data from the EMA (Exponential moving average) and the ATR (Average True Range) to calculate its bands.
- The Upper Band: EMA + (Multiplier * ATR)
- The Lower Band: EMA – (Multiplier * ATR)
- The Middle Band: EMA
The channel uses EMA because the indicator considers the most recent price changes. The default EMA period is the 20-period EMA. A bigger EMA results in a more lagging Keltner channel. Conversely, smaller EMA leads to a more sensitive channel.
- The ATR is there to give a picture of the recent volatility of the price at a specified time. The default ATR parameter for the calculation is 10. The multiplier is used to determine the width of the channel. Bigger multipliers lead to wider channels, and a smaller multiplier leads to narrower channels. The default multiplier for the Keltner channel on MT4 is 2.
How To Trade With The Keltner Channel Indicator
Although more advanced traders might have other uses for the indicator, most of the popular strategies for trading with the indicator are these:
Dynamic Support and Resistance in trends

This strategy helps you to determine market trends and trade with them. The angle of the channel indicates the market trend. An upturned channel signifies that the market is in an uptrend, and a falling channel says the market is in a downtrend.

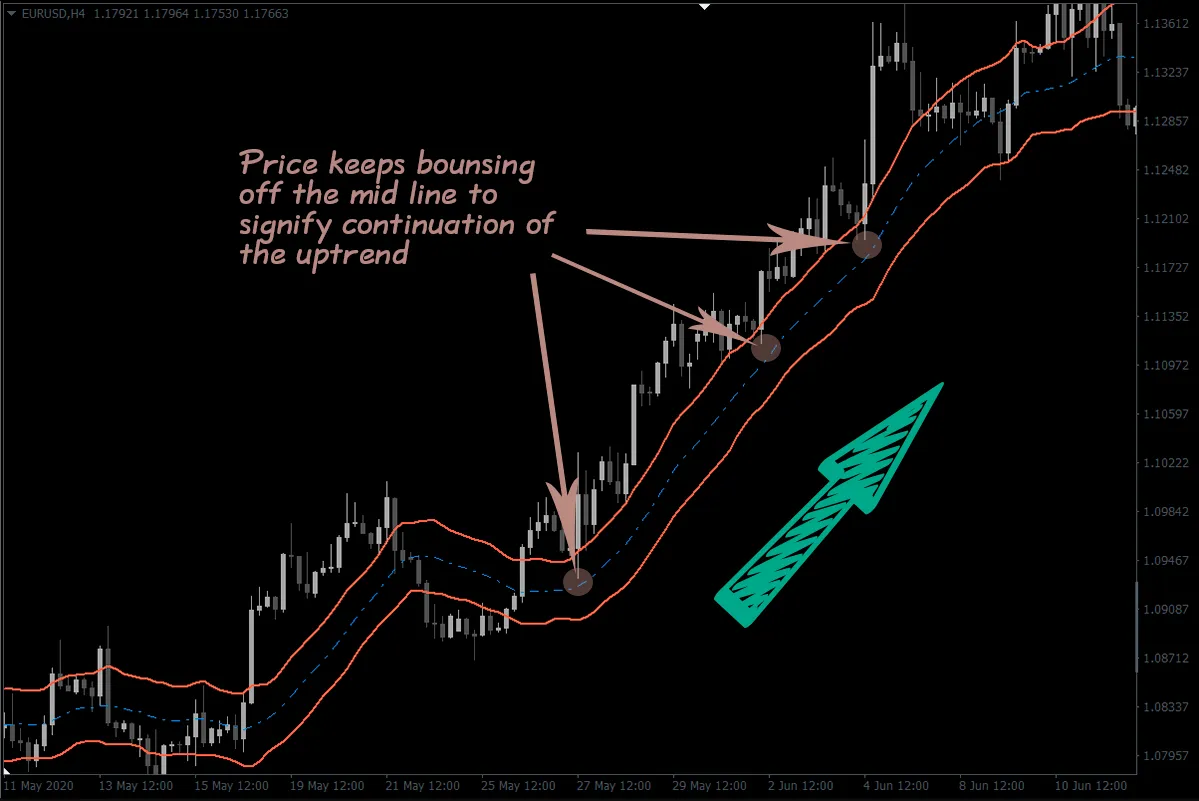
The way the KC indicator signals an uptrend is if price restricts itself to the upper half of the channel. Sometimes, price keeps bouncing back and forth between the upper and middle bands.
In a downtrend, the market restricts itself to the lower half of the channel. And similar to the uptrend condition, price might bounce back and forth the lower and mid bands until the trend is over.

Breakouts
- The Keltner channel indicator also serves as a remarkable breakout signal provider. Many times, price opens inside the channel and closes outside the channel. Whenever this happens, it suggests the price would continue to move in the direction of the breakout for a while. These breakouts sometimes signify the beginning of big market trend moves.

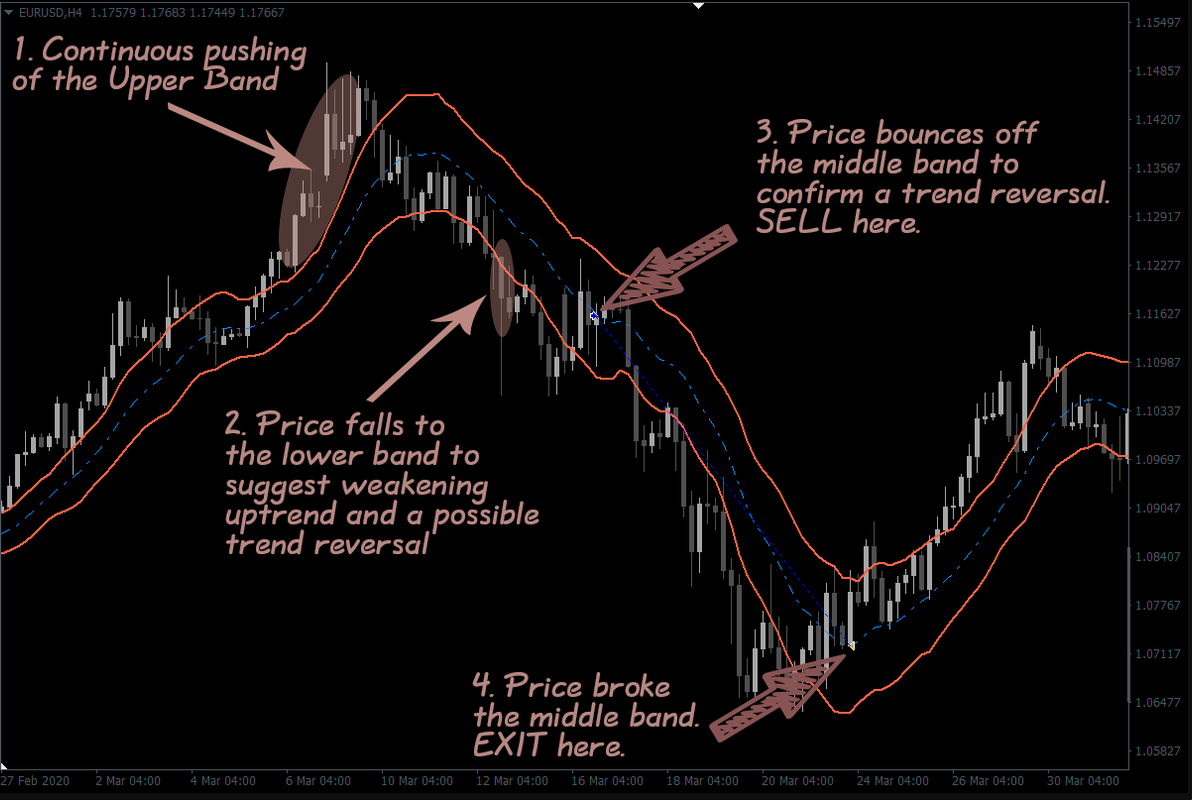
Here is an image of a possible trade scenario:

Trend Reversals
The Keltner channel also offers some powerful signals that reversal trend traders may find useful. When price comes to the lower band after it has continuously hit the upper band without coming down to the lower band, this could be a sign that the uptrend is losing its momentum.
- And when in a downtrend, price keeps hitting the lower band continuously before finally going back to the upper band, signifying that the bulls may be about to take over the market.