
Lucky Reversal Indicator
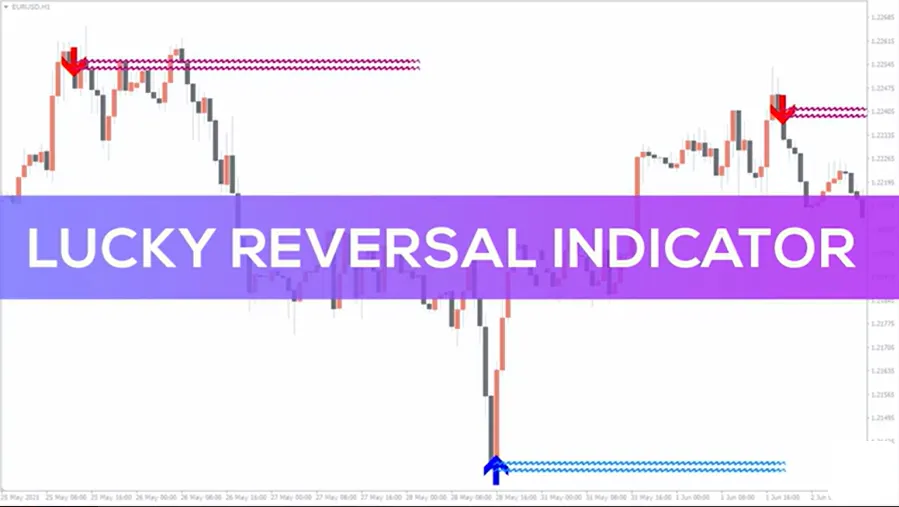
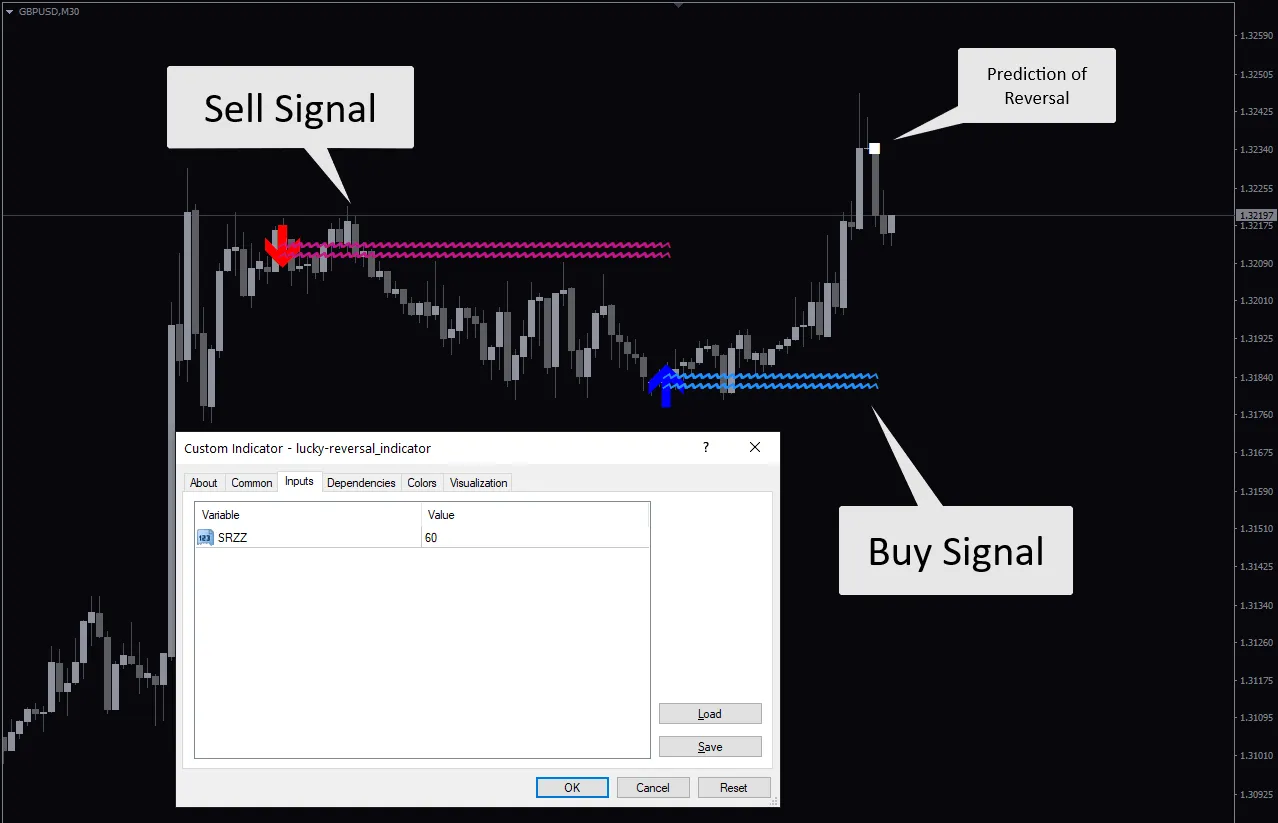
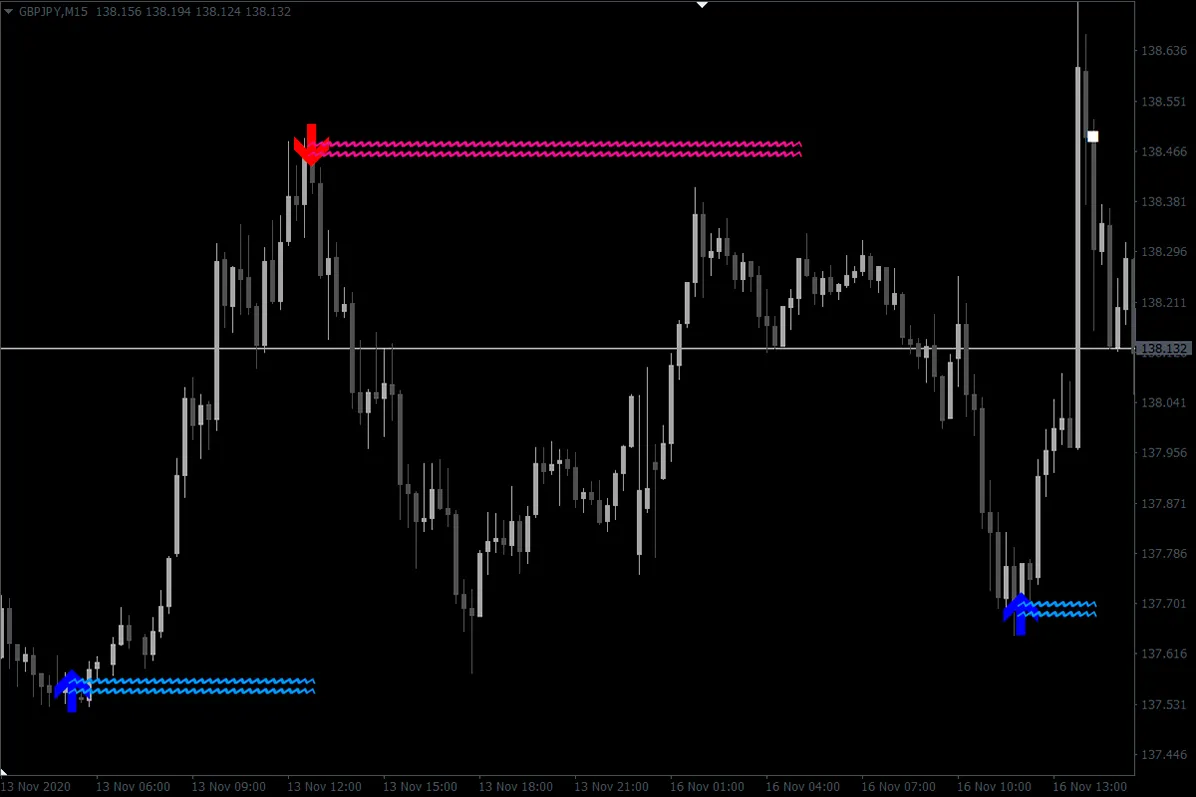
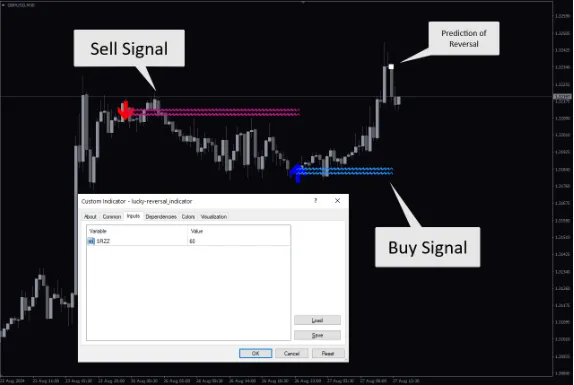
The Lucky Reversal Indicator for MT4 displays clear buy and sell arrow signals in blue and red on the main chart, accompanied by wavy horizontal lines that outline trend direction. It also features a white square that marks potential reversals before they’re confirmed.
Forex trend reversals are a natural part of the market – wherever there’s a trend, a reversal is likely just around the corner. Many trading tools and strategies hinge on this simple truth. The key to success is using the right tools to catch these reversals and ride the trends. One such tool is the Lucky Reversal MT4 Indicator, which stands out among the many reversal indicators available, thanks to its unique features.
What Is the Lucky Reversal Indicator?
- As the name suggests, the Lucky Reversal Indicator helps you spot when a trend shifts—whether it’s turning from an uptrend to a downtrend or vice versa. It signals these shifts with blue and red arrows, each followed by wavy horizontal lines. A blue arrow marks the start of an uptrend, while a red arrow indicates the beginning of a downtrend.
- There’s also a subtle feature you might overlook at first glance: a white square that appears when the indicator suggests a temporary or potential reversal.

The Major Flaw of the Lucky Indicator
- Unlike many other trend reversal indicators, the Lucky Reversal Indicator is a lagging tool. This means it doesn’t help much if you’re trying to catch the beginning of a reversal breakout.
- If you backtest the indicator, you’ll see that the bullish and bearish signals often show up right at the lowest or highest pivot points of significant trend reversals. It might seem like the price reverses just as the arrow appears.
- However, when you test the indicator in a live market, you’ll find that the bullish or bearish signals only show up after the market has already completed a reversal. The reversal arrow appears on the chart only once the reversal is confirmed, highlighting the indicator’s lagging nature.

The Major Strength of the Lucky Indicator
- The very thing that makes the Lucky Reversal Indicator weak also makes it strong. Because it lags, it’s not ideal for catching reversals, but it’s excellent for confirming trades in a newly emerging trend. For example, you can confidently trade the uptrend that follows after the market completes its reversal from a downtrend.
The Lucky Reversal Indicator Trading Strategies
- The best way to use the Lucky Reversal Indicator is by incorporating it into a broader trading system, combining it with other tools. These could be indicators, or they could be elements of market structure, like support and resistance levels, candlestick patterns, or chart patterns.
Here’s an example of how to do that using the Moving Average indicator.
- Combining the Indicator with the Moving Average Indicator
First, add the Lucky Indicator and two Moving Averages to your chart. Keep one Moving Average at its default setting, and set the other to a 20-period Moving Average, giving it a different color to distinguish it. The default Moving Average will serve as the fast MA, and the 20 MA will act as the slow MA.
- Now, wait for the Lucky Indicator to give a buy or sell signal. Remember, because this indicator lags, you’re not looking to trade the initial signal. Instead, you’ll look for entry opportunities in the direction of the trend that the Lucky Reversal Indicator confirms. This is where the two Moving Averages come in.
- When the indicator signals an uptrend, buy only when the fast MA crosses above the slow MA. Don’t sell until the Lucky Reversal Indicator changes from a blue arrow to a red arrow. Similarly, when the indicator signals a downtrend, sell only when the fast MA crosses below the slow MA.

This strategy doesn’t require you to use the specific Moving Average periods mentioned here; you can adjust them or even use different indicators. The goal is to find a best trend-following indicator that complements the Lucky Reversal Indicator.
Having said that, there is still another way to trade the signals of the Lucky indicator. And this brings us to the second trading strategy.
- Trading the Lucky Reversal Indicator Signals
- Often, the Lucky Indicator displays a white square when a reversal is likely. From this point, the price may continue moving, but the white square stays in place. When a trend reversal is confirmed, the white square changes to an uptrend or downtrend signal. Enter your trade at the close of the candle where the white square changes to a buy or sell signal.
- For instance, place a buy trade when the Lucky Indicator confirms an uptrend, and place a sell trade when it confirms a downtrend.
Trade Management
- For both of these strategies, it’s best to set price targets for your take profits. Don’t wait for an opposing signal from the indicators before you exit the trade.
- When setting your stop losses, never risk more than you can afford to lose—typically, no more than 2% of your capital per trade. Keep this in mind and use whichever stop loss method you’re comfortable with.
- A good thing about the Lucky Indicator is that once it draws its wavy lines, the price rarely crosses back over. You might use this to set your stop losses, though it won’t always provide the best risk-to-reward ratios.
Lucky Reversal FAQ
- Who Is the Lucky Reversal Indicator Best For?
The Lucky Reversal Indicator is ideal for intermediate and professional forex traders. Beginners who understand lagging indicators and know how to trade them might also find value in using it but should proceed with caution. To get the most out of this indicator, it’s important first to have a good grasp of how to identify forex trend reversals.
- What time frame works best with the Lucky Reversal Indicator?
The Lucky Reversal Indicator tends to work best on higher time frames like H1, H4, and D1. These time frames reduce market noise and provide more reliable signals. You can use it on lower time frames for shorter trades, but be mindful that the indicator’s lag might be more noticeable.
- Why does the Lucky Reversal Indicator lag, and how does this affect trading?
The indicator is designed to confirm reversals after they’ve begun, which helps avoid false signals. While this means you might miss the early part of a trend, it also protects you from entering trades too soon.
- Can the Lucky Reversal Indicator be used alone?
While it’s possible, it’s better to pair the Lucky Reversal Indicator with other tools like Moving Averages or RSI. This combination improves accuracy and helps you make more informed decisions.
- What does the white square on the chart mean?
The white square signals a potential or temporary reversal. If it changes to a blue or red arrow, the reversal is confirmed, and you can consider trading in the new trend’s direction.
- What if the market moves against the indicator’s signal?
Always have a risk management plan. Set stop losses to protect your capital, and be ready to exit if the market changes unexpectedly. No indicator is foolproof, so caution is key.
- Can this indicator be used in volatile markets?
It can, but be careful. Volatile markets can cause more erratic signals, so it’s important to combine the indicator with tools that help manage volatility.
- What are common mistakes to avoid?
Avoid relying solely on the Lucky Reversal Indicator without confirming signals, ignoring the market context, or using it in highly volatile conditions without additional analysis. Integrating it into a broader strategy will give you better results.
In summary, the Lucky Reversal Indicator for MT4 is a helpful tool for spotting and confirming trend changes. With its easy-to-read signals and compatibility with any trading strategy, it’s great for both new and experienced traders. Use it to improve your trade entries and exits and get an advantage in the forex market. Download it now to boost your trading results.