RSI DIVERGENCE INDICATOR MT4
When price action and the RSI indicator are no longer reflecting the same momentum, an RSI divergence indicator signal traders.
- The RSI (Relative Strength Index) is a momentum indicator that evaluates price change to identify overbought or oversold market conditions.
It has a scale from 0 to 100. When the Relative Strength Index drops below 30, the market is considered oversold. If the Index value exceeds 70, the market is deemed overbought.
The lack of signals is one of the major issues experienced when employing an indicator. This indicator hardly reaches the overbought and oversold levels.
- To counter this problem, you need divergence from the standard Indicator.
Divergence can assist you in determining when the market is likely to resume its trend following a pullback.
If a chart exhibits an RSI divergence, the relative strength index on the chart produces lower highs. This happens when the price makes higher highs. On the other hand, when the price makes new lower lows, the indicator shows higher lows.

- An RSI divergence occurs when the Index stops breaking out to higher highs in an uptrend or breaks down to lower lows during a downtrend.
A divergence indicates that the present trend has lost traction. This could be a signal and setup to bet on a reversal in the direction of market price activity.
A bullish divergence pops up when the RSI indicator is oversold, followed by a higher low that corresponds to lower lows in the price movement. A bearish divergence is identified when the Relative Strength Index indicator is overbought, followed by a lower high that correlates to higher highs.
RSI Divergence Indicator BUY/SELL Signals
- To find buy or sell signals with Indicator, you need to locate bullish and bearish divergences. The bullish divergence will give us buy signals, while the bearish divergence will give us sell signals.
Buy signals

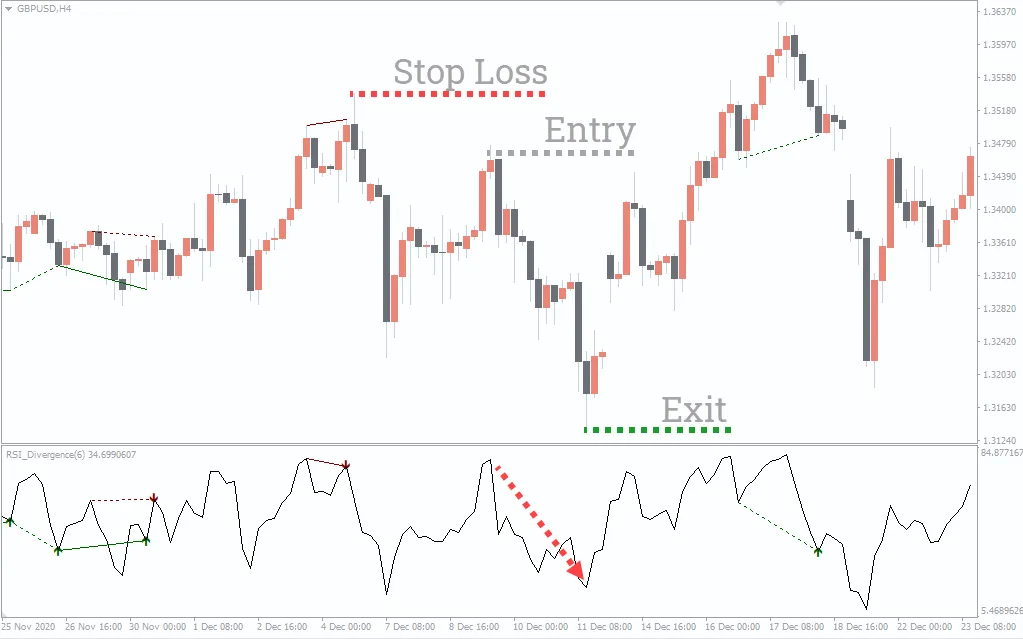
- The above chart illustrates an uptrend. As you can see, we enter the trade when the Indicator shows lower highs with an oversold condition. This confirms a bullish divergence.
You can either wait for the confirmation candle or take a position when the RSI hits the oversold territory. You can place a stop-loss near the recent low and exit the trade when the RSI Divergence starts to downturn.
Sell signals

- On the above chart, you can see that when the Divergence Indicator shows higher lows with an overbought condition. The price did pullback but eventually continued the downtrend.
We entered the trade when the RSI Divergence indicator showed the overbought condition, with stop-loss near the recent high and exit when the RSI Divergence starts to climb up.
Bottom line RSI Divergence indicator
- The standard RSI indicator is prone to false signals and sometimes doesn’t show overbought and oversold zones. The RSI Divergence Indicator combine divergences with the classic RSI to give you an overall idea of where the price might be heading next.


