

SHVED SUPPLY & DEMAND INDICATOR MT4
The indicator automatically plots supply and demand zones on the chart. Trading activity of Forex market participants is higher next to these levels. This allows you to identify potentially profitable points for trading.
You most likely know that the ever-changing ratio of buyers and sellers is behind all the price movements in the Forex market.
By default, the MT4 terminal doesn’t have the indicator that can highlight the zones where key changes in this ratio take place.This is why we suggest you to check out this free Shved Supply & Demand indicator developed for spotting and automatic drawing levels of that sort.
Contents:
- Description Shved Supply & Demand indicator.
- What kind of zones does the Shved Supply & Demand plot?
- Examples of how to use the indicator
- Description Shved Supply & Demand Indicator
Zones of supply and demand are the levels, near which the heightened Forex market activity could be previously seen.

- These values are interesting to us because the repeated price interaction with them makes it possible to determine potentially profitable points to enter trades.
- Levels are drawn based on those supply and demand zones, from which there has already been a fairly strong targeted movement.
Height of the zones depends on the price activity near them. If the levels have repeatedly sparked the interest of traders, and the price went up/down after responding to them, the height will be visually greater.
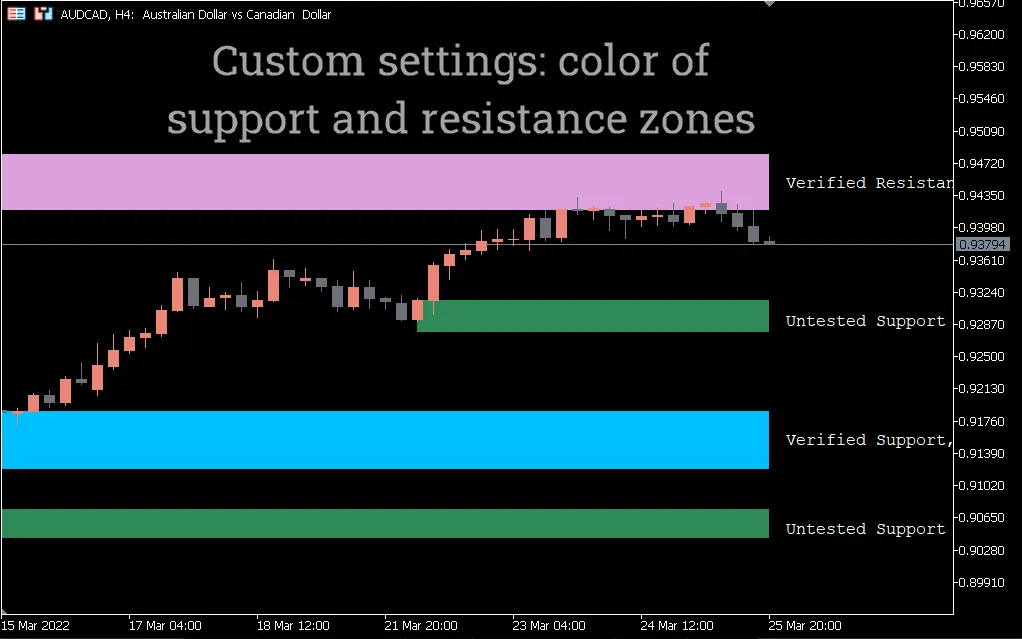
- For convenience, all the chart formations have a short text description, so you won’t have a problem understanding what the highlighted level means.
Like most Forex market indicators, Shved Supply and Demand gives more valid signals on higher timeframes. This is because there is a fair amount of market noise at low timeframes.
You should also keep in mind that the more often the price has tested supply and demand zones, the more actual they can be.
- What kind of zones does the Shved Supply & Demand plot?
This indicator highlights a total of 5 types of the levels:
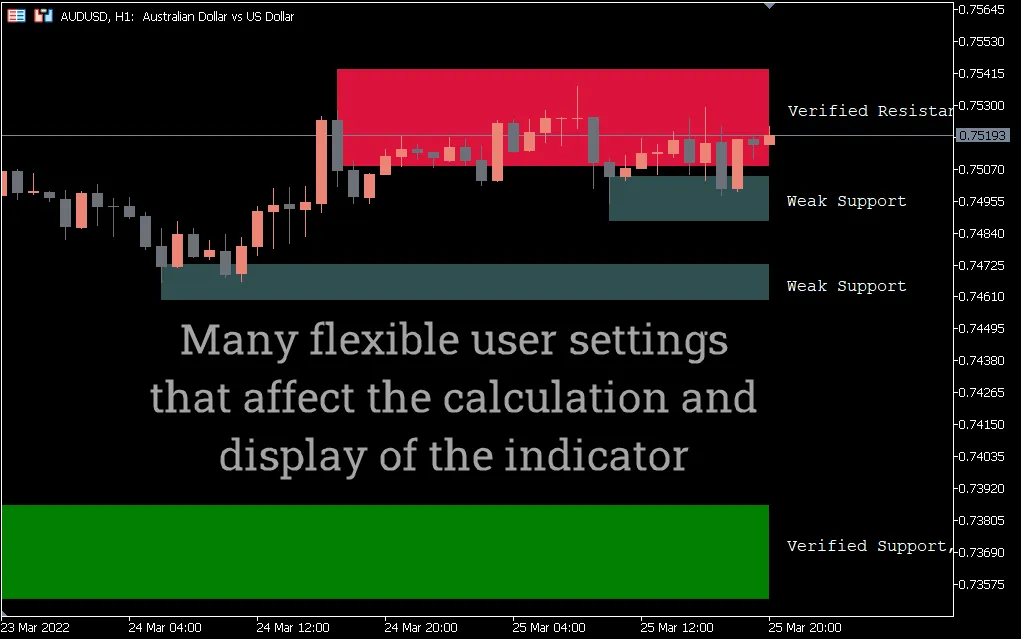
- Weak zone – weak zone. There is no excess demand or supply close to these values. Accordingly, you should either avoid trading around them or do it carefully.
- Untested zone – not yet tested zone. They include those supply and demand zones, from which the price has once made a strong and targeted move.
- Verified zone – already tested (verified) level. These are the values where new interest in trading has been sparked 2 or more times. The indicator displays the number of retesting such formations on the chart. The higher the number of retests, the stronger the zone.
- Proven zone – repeatedly tested (proven) pattern. As a rule, trading activity almost always resumes from these values even to the point when a level is broken out and the trend changes.
- Turncoat zone – so-called “mirror” levels. Initially, such zones act as resistance/support. However, due to changes in supply and demand, the levels are broken out and used to trade in the opposite direction.
- Examples of how to use the Shved Supply & Demand Indicator
When using the indicator, you can work in two ways: towards the main trend and when it changes to the opposite.
Trading during a trend change:

The chart above shows the downtrend changing to the uptrend. Let’s examine the principle behind using the indicator in this example in more details:
- 1 – the first strong rally wave. The rise in the price is the result of high demand of Forex market participants. When this movement is over, the zone is granted the “Untested” status.
- 2 – when the price is approaching the level, we can see the second momentum upward movement. The chart formation is getting more and more interesting for buyers and attains the “Verified” status.
- 3 – the third rally wave makes a new high that indicates a potential of the uptrend to continue its move. After the price has formed three rally waves, the level gets the status of “Proven”.
- 4 – the next time, when the price is approaching the zone, is accompanied by a new bullish movement – this time we can look for Buy entry points.
- 5 – this is where you should place a pending Stop Loss order.
Trading with the main trend
In this case, we can see a downtrend with retracement rally waves.

The principle of trading towards a trend is similar to that of trading during a trend change:
- 1 – the upward movement is a retracement one in relation to the main Sell trend.
- 2 – the first sell-off wave moving below the last low is a sign of sellers’ power. When the price approaches this level next time, you can look for Sell entry points.
- 3 – the second sell-off wave starting from the level – at this time we can look for entry points to sell at the market price.
- 4 – this is the level where you should place a pending Stop Loss order
Although the indicator highlights the zones that are interesting to Forex market participants, the indicator’s signals can be more efficient when using additional trading tools.
Using Shved Supply and Demand Indicator together along with other indicators or with indicator-free trading systems (Price Action and candlestick patterns), you’ll increase your chances of making profitable trades in the Forex market.
No matter what kind of trading approach you’ll ultimately stick to, the Shved Supply&Demand indicator can be a helpful complement to it. The point is that the odds of resuming the movement from the levels of trading activity that the indicator plots will significantly improve.