


Multi-Timeframe Moving Averages
The MTFMA (Multi-Timeframe Moving Averages) indicator uses multiple moving averages (MAs) across different timeframes to provide buy and sell signals (which do not repaint) in a separate window from the main chart. It is versatile and easy to interpret, suitable for both scalping on smaller timeframes and long-term trading on larger timeframes.
Why is it Multiframe?
The term multiframe refers to the indicator’s ability to use and combine data from multiple timeframes. The MTFMA calculates and displays signals based on four configurable moving averages (MAs). Each MA can be adjusted for different periods, calculation methods, and price types, allowing traders to see a combination of short-term and long-term trends on a single chart.
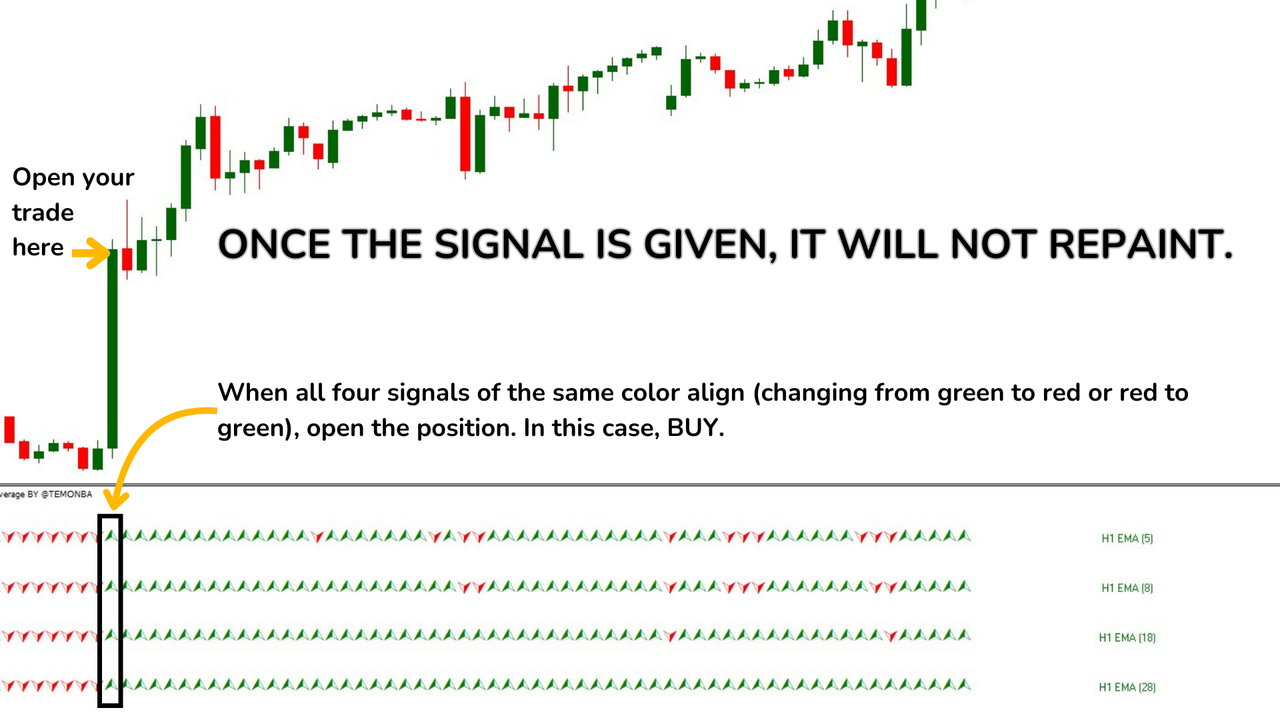
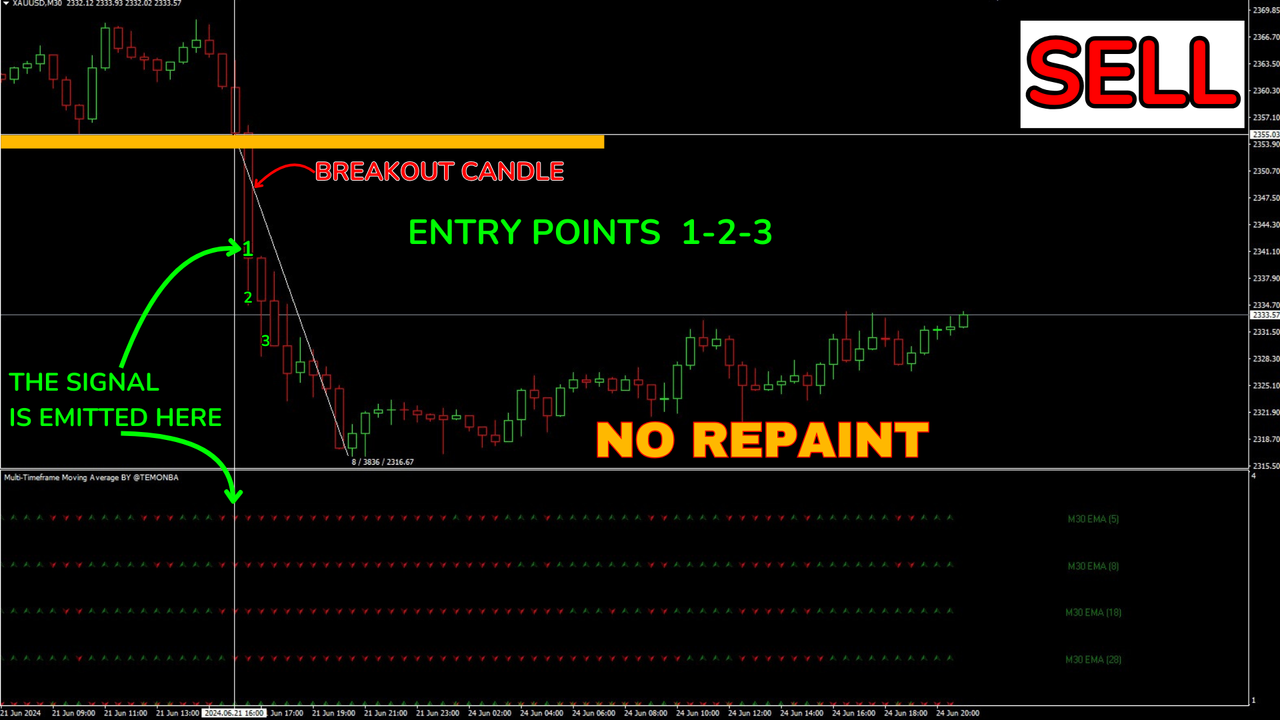
Key Points: Versatility: Usable on any timeframe, from minutes to months, suitable for both scalping and long-term trading. Does not repaint: Once a signal (up or down arrow) is generated, it does not change color, allowing traders to rely on the signals generated to make trading decisions. Easy interpretation: Buy and sell signals are clearly displayed with green and red arrows in the lower indicator, eliminating the need for complex analysis. Configurability: Users can adjust the moving averages parameters to suit their specific trading strategies.
Enhanced Strategy: To make safe entries, it is advisable to wait until all four EMAs change to the same color. The best entry is made on the first or second candle where all four EMAs change color.
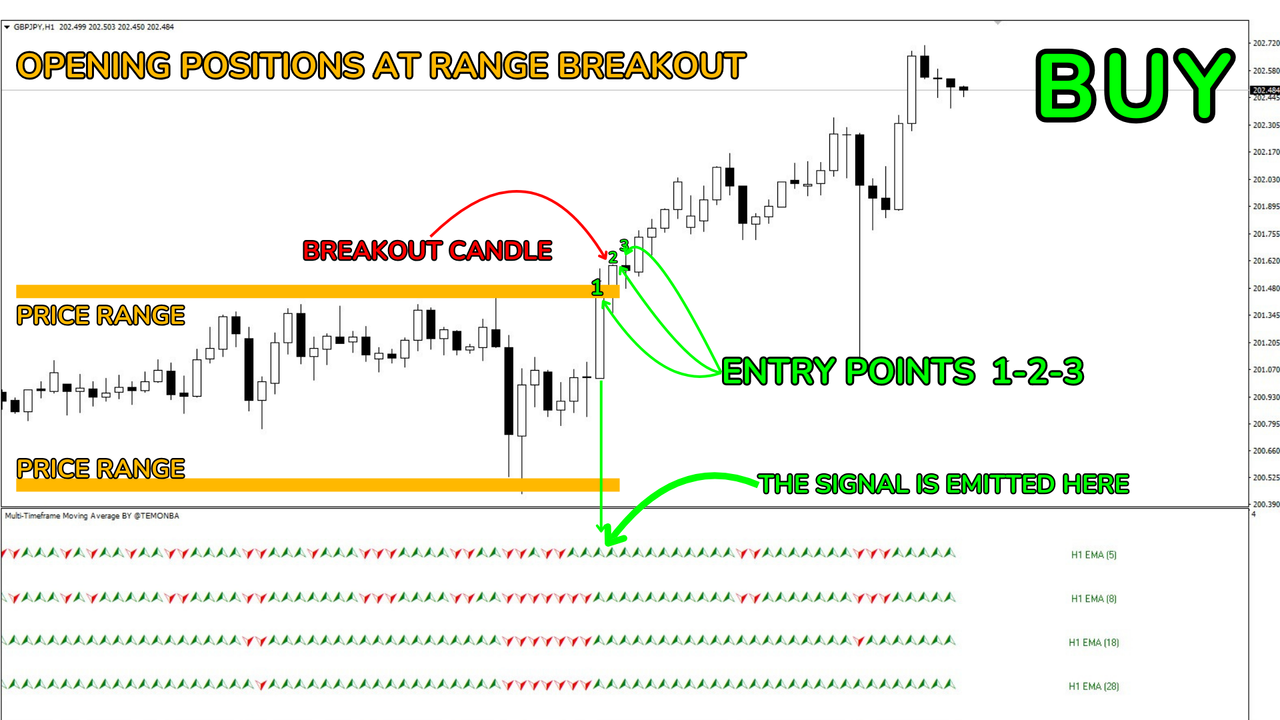
Only if it coincides with a range breakout, you can open your position up to 4 or even 5 candles after the color match in the 4 EMAs. I want to emphasize that this type of late entry can only be made if there is a clear breakout of the price range. If you cannot detect it, simply limit yourself to taking trades on the first or second candle.
In all cases, avoid taking trades in already advanced trends (for example, if 10 candles have passed with the same color), as the chances of the trend continuing are lower.
So:
Buy: All EMAs change to green. Sell: All EMAs change to red.
How to Use the Indicator:
For Scalping (Small Timeframes like M1, M5, M15):
Buy Signal and Sell Signal: The opening must be done in favor of the EMA trend “candle by candle,” opening short trades and quickly obtaining a few pips. Of course, to perform this technique, you must have a Scalping account. That is, if you want to scalp with a Standard or Cent account, understand that it will not work, as some pairs have a lot of spread. Only use specific accounts for Scalping (ECN or Zero Spread).
For Long-Term Trading (Larger Timeframes like H1, H4, D1):
Buy Signal: All EMAs change to green. Take the entry on the first candle where all four EMAs are green. Sell Signal: All EMAs change to red. Take the entry on the first candle where all four EMAs are red. In larger timeframes, the signals will be less frequent but more significant, allowing you to capture larger market movements and hold positions longer.
How to take Trades if you have no experience:
Buy:
Wait until all four EMAs change to green. Open a buy position (Buy) on the first candle where all four EMAs are green. Place a stop loss below the last significant support. Close the position or consider a sell when all four EMAs change to red. Sell:
Wait until all four EMAs change to red. Open a sell position (Sell) on the first candle where all four EMAs are red. Place a stop loss above the last significant resistance. Close the position or consider a buy when all four EMAs change to green. In summary, the MTFMA is a powerful and versatile indicator. Whether for inexperienced or advanced traders, it is 100% configurable from the indicator’s external parameters.
Why does the MTFMA not repaint? Calculation based on closed bars:
The MTFMA indicator calculates its values based on closed bars and not on bars that are currently forming. In the internal code, the calculation is performed in a loop that runs from limit – 1 to 0, ensuring that it works with historical data that will not change.
Output buffers and empty values:
The indicator uses buffers (MA1_UP_Buffer, MA1_DN_Buffer, etc.) to store the calculated values. These buffers are updated in each iteration of the loop, and values are set only if they meet certain conditions (e.g., if the current EMA is greater or less than the previous EMA). Once a value is placed in the buffer, it does not change, ensuring that the signals generated in the past remain constant.
Comparison of moving average values:
The buy and sell signals are calculated based on the comparison of moving average values in the current and previous bars. These comparisons are made once the bar closes, ensuring that the values used for comparison do not change.
Color assignment based on fixed conditions:
The colors of the labels and signals are assigned based on fixed conditions (e.g., if the current EMA is greater than the previous one, a specific value is set in the signal buffer). These assignments do not change once made, guaranteeing the consistency of the signals.
Configuration Parameters:
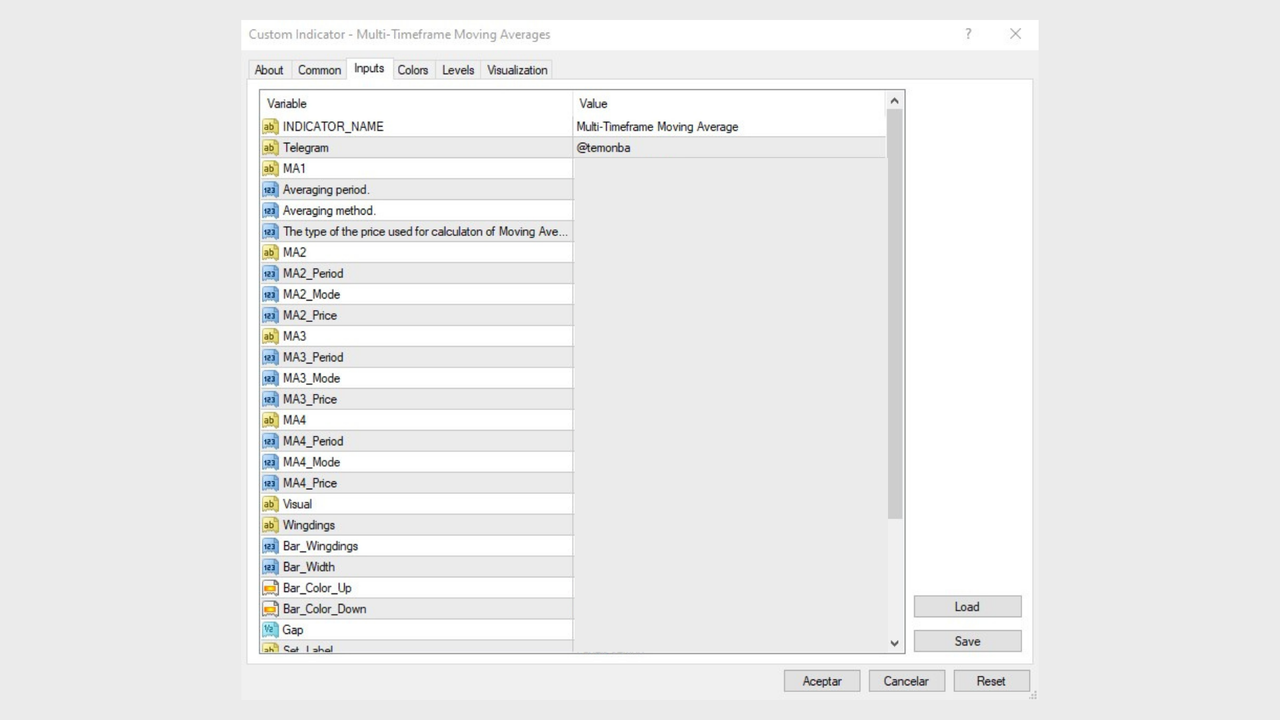
- MA1 (1st Moving Average) Averaging period (MA1_Period): The averaging period for the first moving average. This parameter determines how many periods of data will be used to calculate the moving average. In this case, it is 5. Averaging method (MA1_Mode): The averaging method used to calculate the moving average. Typical values can be: 0: Simple Moving Average (SMA) 1: Exponential Moving Average (EMA) 2: Smoothed Simple Moving Average (SSMA) 3: Linear Weighted Moving Average (LWMA) The type of the price used for calculation of Moving Average (MA1_Price): The type of price used to calculate the moving average. Typical values can be: 0: Closing price (Close) 1: Opening price (Open) 2: Maximum (High) 3: Minimum (Low) 4: Median price (Median) 5: Typical price (Typical) 6: Weighted price (Weighted)
- MA2 (2nd Moving Average) MA2_Period: The averaging period for the second moving average. In this case, it is 8. MA2_Mode: The averaging method used to calculate the second moving average. In this case, it is EMA (1). MA2_Price: The type of price used to calculate the second moving average. In this case, it is the weighted price (6).
- MA3 (3rd Moving Average) MA3_Period: The averaging period for the third moving average. In this case, it is 18. MA3_Mode: The averaging method used to calculate the third moving average. In this case, it is EMA (1). MA3_Price: The type of price used to calculate the third moving average. In this case, it is the weighted price (6).
- MA4 (4th Moving Average) MA4_Period: The averaging period for the fourth moving average. In this case, it is 28. MA4_Mode: The averaging method used to calculate the fourth moving average. In this case, it is EMA (1). MA4_Price: The type of price used to calculate the fourth moving average. In this case, it is the weighted price (6).
- Visual (Display parameters) Wingdings: Selection of the type of symbols for the arrows indicating buy and sell signals. 0: Rectangles. 1: Arrows. Bar_Wingdings: The specific type of symbol used. Bar_Width: The width of the arrows or symbols displayed on the chart. Bar_Color_Up: The color used for the up arrows or symbols (indicating buy). In this case, it is green. Bar_Color_Down: The color used for the down arrows or symbols (indicating sell). In this case, it is red. Gap: The vertical distance between the arrows or symbols on the chart.
- Set_Label (Labels setting) Show_Label: Boolean parameter to show or hide text labels. V_Label: Vertical offset for text labels. V_Shift: The specific amount of vertical offset. H_Label: Horizontal offset for text labels. H_Shift: The specific amount of horizontal offset. UP_DN (Moving average Color UP/DOWN) Text_Color_UP: The color of the text when the moving averages indicate an uptrend. In this case, it is green. Text_Color_Down: The color of the text when the moving averages indicate a downtrend. In this case, it is red.