
FOREX SUPERTREND POWERFUL ADVANCE PROFIT ULTIMATE INDICATOR
The forex supertrend indicator pack is a complete system that you read and trade by hand. It is not a robot, so nothing opens an order for you. Instead, a green line, a red line and two lower indicators tell you what the market is doing, and you decide when to click.
Forex supertrend indicator specification
- Platform: MT4
- Timeframes: ALL- H1 ESPECIALLY RECOMMENDED
- Repaint: NO, we will open trades at the beginning of a candle and close trades at the end of the candle. Markets: Fits arround your schedule.
The forex supertrend indicator as a complete system
Perfect for Begginers!
- This complete forex trading system has a cross-confirmation trading mechanism of technical indicators plus trend indicators.
- As everyone knows, the ideal is to discover the beginning of a trend or micro trend and exploit the price movement to the maximum.
- These indicators show us the most favorable entry and at the same time the safest way to take the beginning of a trend change. They are configured to give firm and safe entries.
Because the tools confirm each other, you never act on a single line. Moreover, nothing repaints, so a closed candle keeps its colour. Therefore, you can review your own week and learn from what really happened.
Why we start on the M1 chart
The system works so well, that despite recommending its use in H1, I will start by showing you the most difficult timeframe to predict as M1.
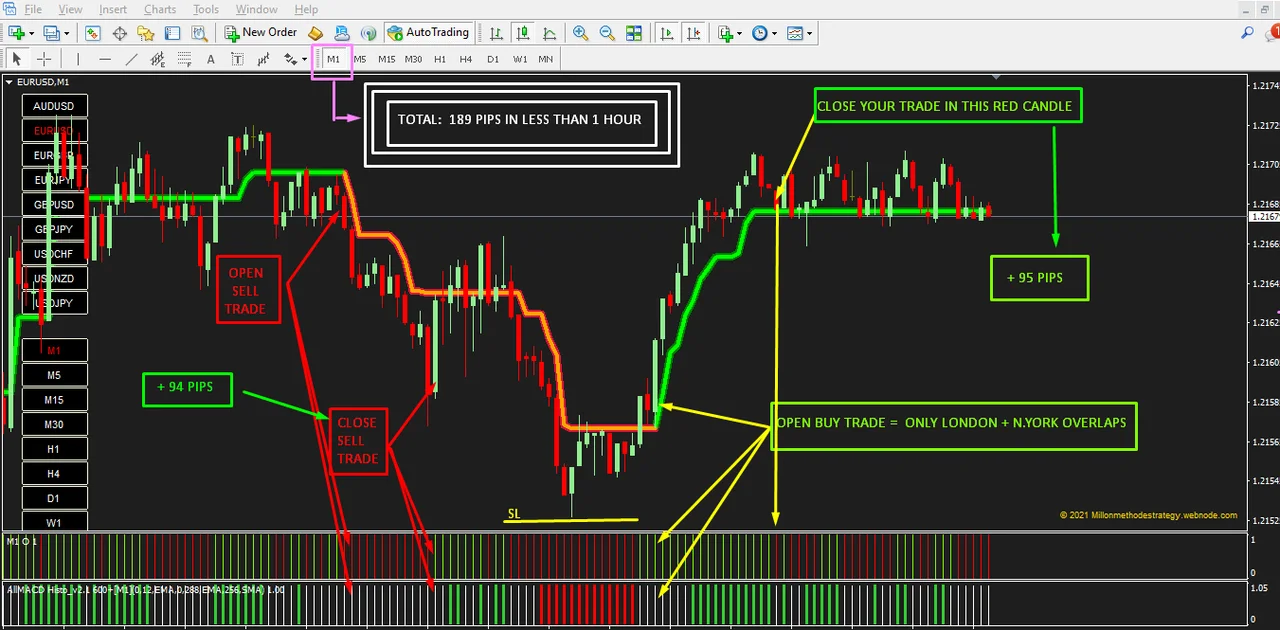
Notice how profitable it is, that despite being in M1 and not in a defined up or down trend, but within a range, the system earns its pips. See how it is able to capture a SELL, making us take a trade on the red candle that coincides with the lower indicators in RED AND WHITE. After that, the indicators turn green and white, so we take profit with +94 PIPS.
Then, within the same hour, it allows us to open another trade, this time a BUY that gives us +95 PIPS. In total we have taken +189 PIPS, in two trades already closed in less than 1 hour.
So, how we take the trades?
BUY TRADE:
1- CANDLE ABOVE GREEN LINE
2-TWO LOWER INDICATORS IN GREEN (STRONG TRADE), WHEN THERE IS A LOT OF VOLATILITY AND ONLY WHEN NEW YORK AND LONDON OVERLAP, YOU CAN TAKE A TRADE WITH THE FIRST INDICATOR IN GREEN AND THE SECOND IN WHITE (NOT SO STRONG).
Take profit and stop loss on a buy
TAKE PROFITS:
TP1: WHEN THE LOWER INDICATORS ARE RED AND WHITE, YOU CAN:
-CLOSE THE TRADE AND KEEP THAT PROFIT.
-YOU CAN CLOSE 50% OF THE TRADE AND WAIT FOR HIGHER PROFITS WITH TP2
-YOU CAN PUT TRAILING SPTOP – BREAKEVEN.
TP2: WHEN THE CURRENT CANDLE GOES BELOW THE GREEN LINE OR THE LOWER RED AND WHITE INDICATORS APPEAR AGAIN.
STOP LOSS:
YOU MUST PLACE THE SL BELOW THE LAST SUPPORT.
If those two words are new to you, then read how support and resistance work. After that, the placement of the stop becomes obvious rather than arbitrary.
A buy example with the forex supertrend indicator
Let’s look at a buy example:
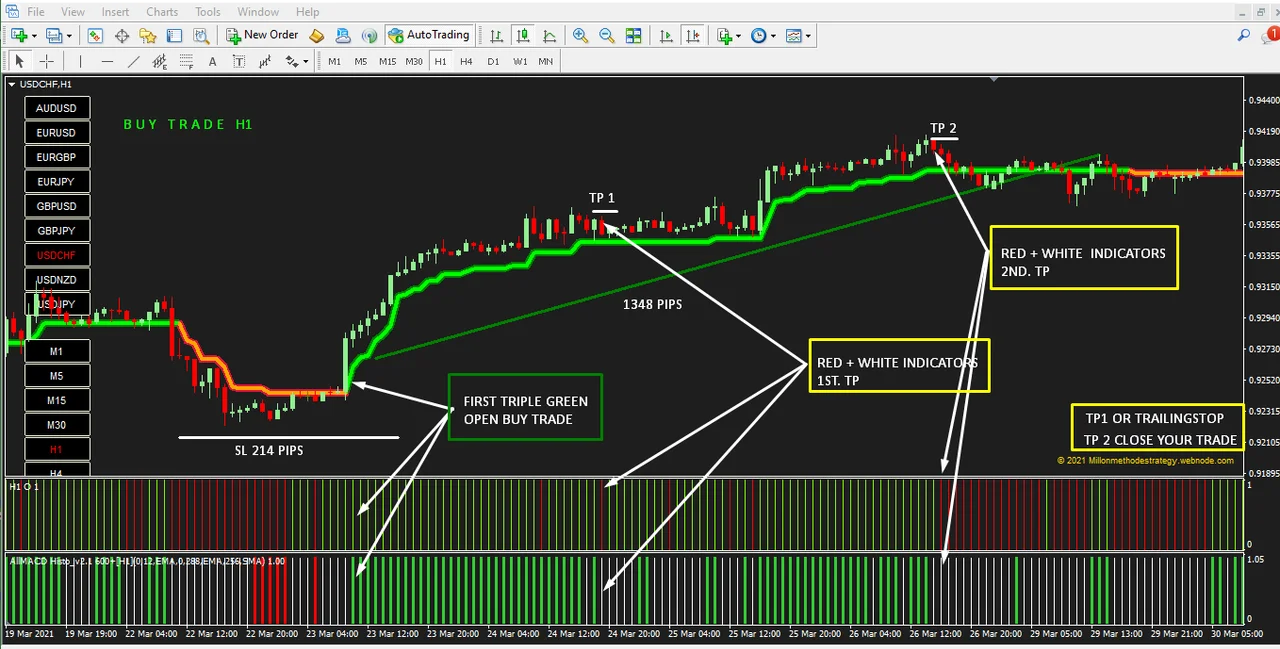
In this example we can see where we would place a BUY trade, above the green line with both lower indicators in green. Next, we would place the SL below the last support. Our main profit target is TP1, so we let it run until the lower indicators show red and white.
There we could close the trade or keep it open until TP2. That second target happens when the indicator shows red and white again, always when that candle closes. Alternatively, given the high profits of this trade, we could wait for price to cross the green line down and then close our TP2.
This is a strong trade, as we start with both indicators in green.
The weak signal and the session overlap
But there is an important exception: ONLY WHEN NEW YORK + LONDON OVERLAP, as there is high volatility. We can take the following trade with the lower indicators in GREEN+WHITE. But if you are not in the overlap of both markets, it is very likely to sideways. That is why unless you are 100% sure that you are in that overlap, it is better not to take the trades with the indicators as in the following image.
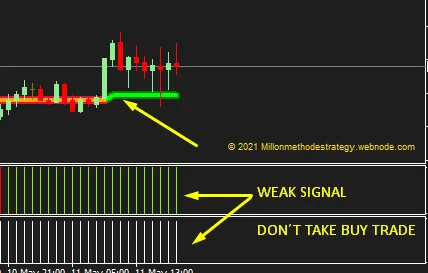
If you are an intermediate trader, and you know perfectly well the market hours in your time zone, you can use the double green-white signal.
If you are a new trader, it is better to wait for the green-green signal at ANY TIME.
How we take a SELL trade
SELL TRADE:
1- CANDLE BELOW RED LINE
2-TWO LOWER INDICATORS IN RED OR RED AND WHITE (There is no problem with Red +White as the lows are usually steeper than the highs)
Take profit and stop loss on a sell
TAKE PROFITS:
TP1: WHEN THE LOWER INDICATORS ARE GREEN, YOU CAN:
-CLOSE THE TRADE AND KEEP THAT PROFIT
-YOU CAN CLOSE 50% OF THE TRADE AND WAIT FOR HIGHER PROFITS WITH TP2
-YOU CAN SET TRAILING SPTOP – BREAKEVEN
TP2: WHEN THE CURRENT CANDLE GOES ABOVE THE RED LINE OR WHEN THE LOWER GREEN AND WHITE INDICATORS APPEAR AGAIN.
STOP LOSS:
YOU MUST PLACE THE SL ABOVE THE LAST RESISTANCE.
A sell example on the chart
Let’s look at a sell example:
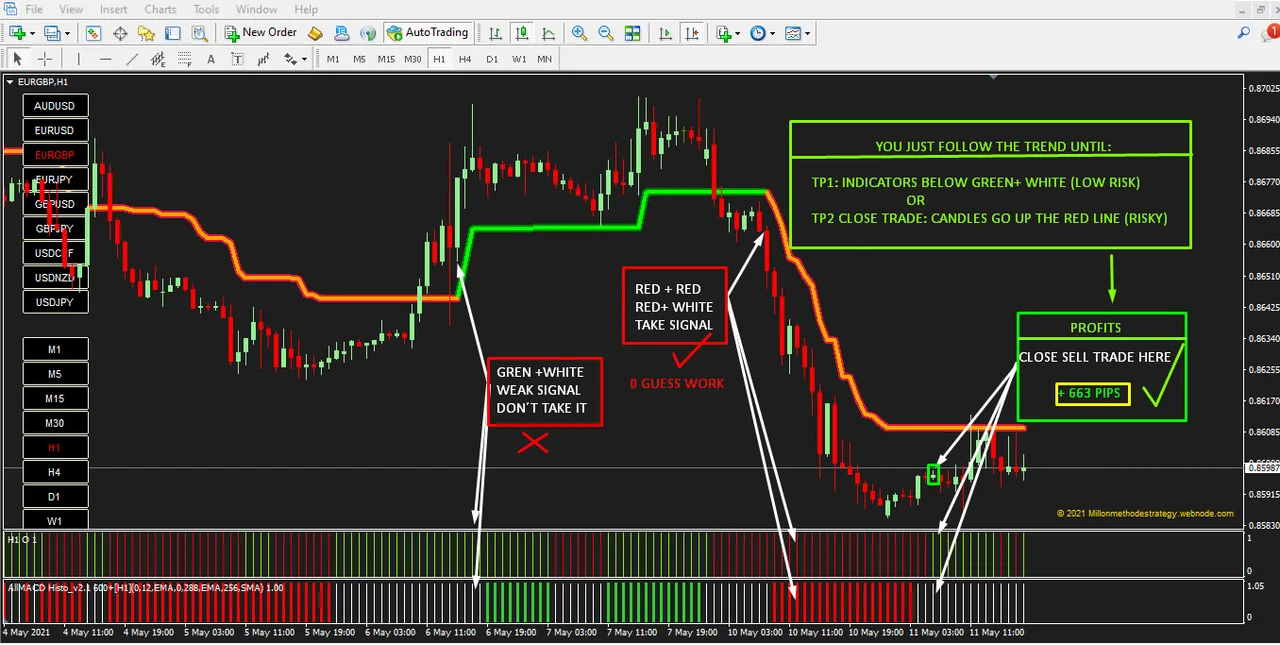
In this example we can see where we would place a SELL trade, below the RED line with both lower indicators in red. Then we would place the SL above the last resistance. Our main profit target is TP1, so we let it run until the lower indicators show green and white.
There we could close the trade or keep it open until TP2. That happens in just a few subsequent candles that touch the red line. Although they then go back down, they start to sideways, and it is not good to stay within the sideways if possible.
So, although price could perhaps continue to go down, we have a lot of closed candles with their indicators in green and white. We should not go that far. The 2nd TP should be closed as soon as there is an attempt of only 1 candle to go above the red line. We have already won 663 pips, no need to risk too much!
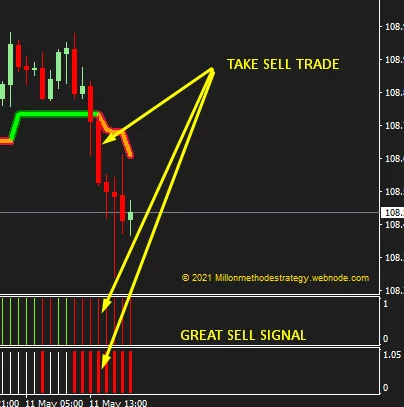
This is a strong sell trade, as we start with both indicators in red. So, look at this another example of strong sell trade:
The forex supertrend indicator in an erratic market
IT WORKS EVEN WHEN THE MARKET IS ERRATIC! Check this out
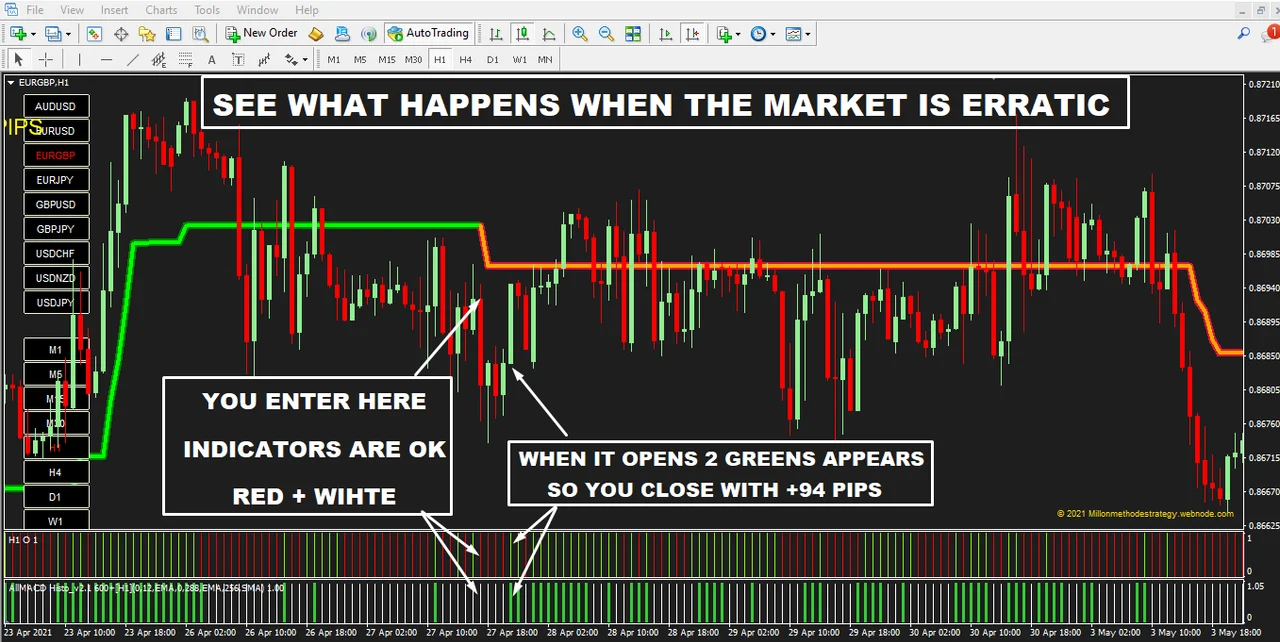
Look at this market, it is very erratic, lateralized, with many resistances. It is in range, but with candles that fill almost the entire range. Therefore, it is not ideal to make our entries. You see how dizzy it is? Well, you have to try to avoid this type of market where the candles fills the entire range.
But if you didn’t notice, and you just saw all the indicators in position and entered, don’t worry because the indicator will NOT LEAVE YOU!
Let’s suppose that you have entered where the first white arrow shows you. That is, the red candle opens below the red line, which has just started to be red, and the indicators are in RED and WHITE. Well, don’t go crazy! Just wait for the first green candle to close. As soon as the second one opens, both lower indicators will be in GREEN, and there you close your trade.
SO IN THE WORST POSSIBLE MARKET, IN THE WORST POSSIBLE SITUATION, YOU EXIT WITH +94 PIPS. ABSOLUTELY PROFITABLE.
Markets without a defined trend
EVEN IN MARKETS THAT DO NOT HAVE A STRONG OR DEFINED TREND!!!
Check this out:
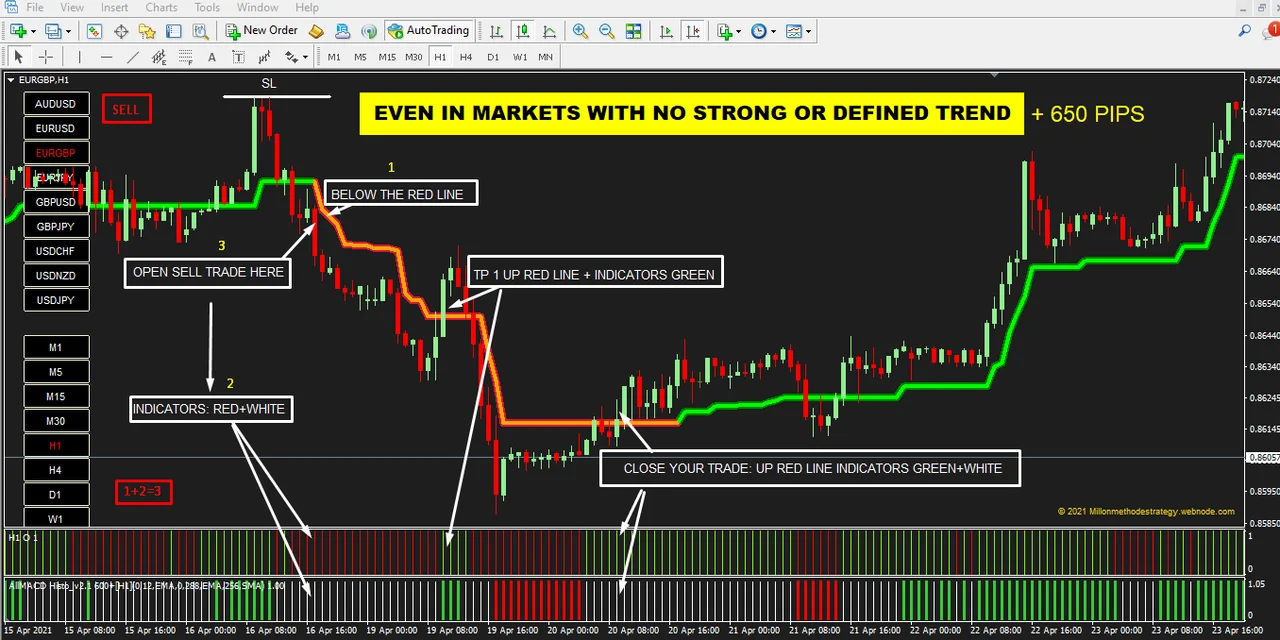
Yes, even in this type of market, with downward and upward trends, it is highly profitable. On the downside alone we collected +650 pips and then another 700 pips on the upside!
It’s very easy to show a chart with a huge drawdown of 2500 pips, but THIS IS WHAT YOU WILL FIND IN A REAL MARKET.
This is why I have given examples of ERRANT MARKETS AND MARKETS WITHOUT DEFINED TRENDS.
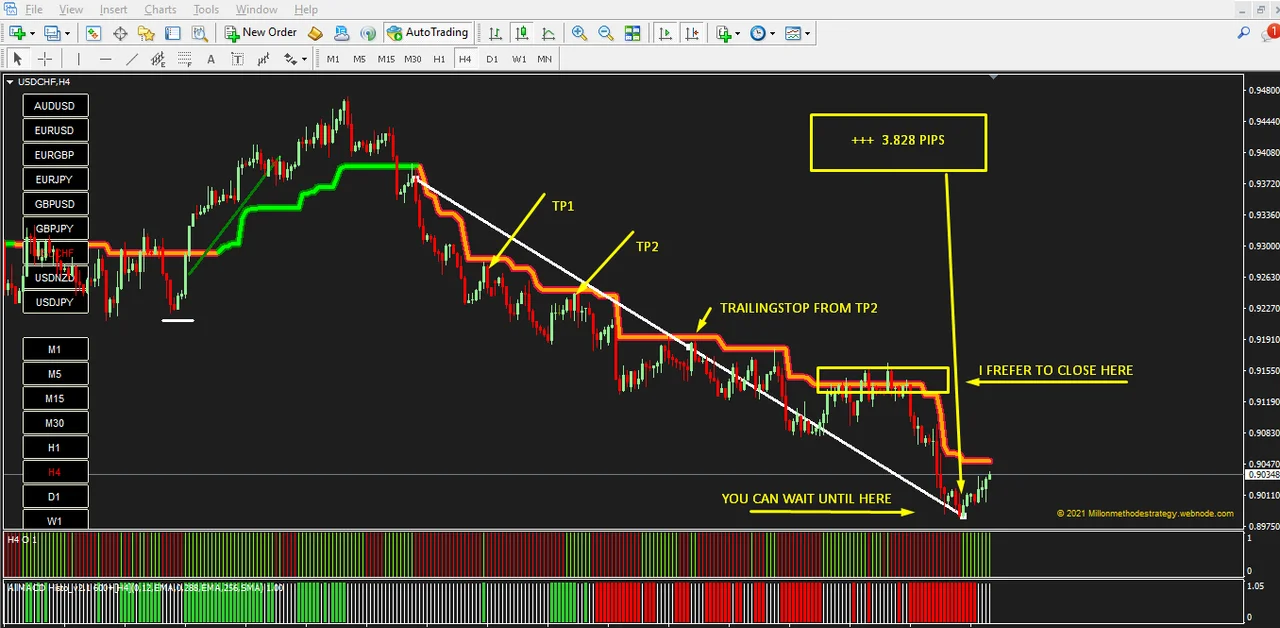
But I can also show you a big fall, 3828 pips and counting, it’s super! But don’t just close yourself in the idea of 3000+ pips, as this is NOT THE REALITY OF THE MARKETS all the time. So, you need a system that can handle the Real markets, although of course it will work wonderfully for this type of market.
Installing the forex supertrend indicator
First, open MetaTrader and click File > Open Data Folder. Then copy the indicator files into the Indicators folder and the template into the Templates folder, both inside that data folder. Next, restart the platform or refresh the Navigator panel. Finally, open an H1 chart and apply the template, so the lines and the two lower indicators appear together.
Zero guesswork with the forex supertrend indicator
The important thing is thay you will always know what to do in every situation, zero guess work. You will know where exactly to put the SL. Furthermore, you will be able to decide for yourself when it is more convenient for you to take profit, whether in TP1 or TP2, because the lower indicators will tell you when it is TP1 and when it is TP2.
Before you trade
Try the template on a demo account first, and keep the size small when you move to a live one. Trading involves risk, therefore only trade with money you can afford to lose. Past results do not guarantee future results. You trade at your own risk.
Would you like more tools for manual trading? Then browse the rest of our forex systems and indicators.