
H1 POWER TREND MT4 FOREX SIGNAL
You read five indicators and you place the order yourself. The h1 power trend is a manual signal package for MT4, so nothing trades on your behalf. Five trend tools sit on one chart, and they have to agree before you act. Moreover, the home timeframe is H1, therefore both scalpers and swing traders can work with it.

What the h1 power trend direction package does
1H POWER TREND DIRECTION
This strategy is especially designed for forex traders who wish to trade in favor of the trend.
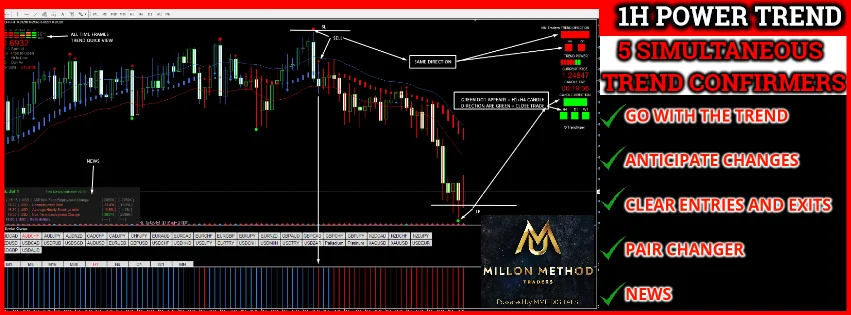
We mainly highlight that it has 5 simultaneous trend indicators working together, which allows an ideal detection of the current trend, and therefore an early detection of changes in the trend (Reversal), which means that you can open your trades at the beginning of reversals or pullbacks. This is ideal for Scalpers and Swing Traders.
In other words, one tool alone can lie, yet five rarely do at the same time. Because every window answers a different question, a false start shows up quickly. As a result, you skip many of the entries that usually cost money.
The five indicators, one by one
1. Three timeframes trend direction
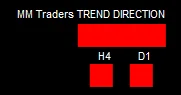
This indicator shows us the actual TF + the following 2 TFs
- If the 3 timeframes coincide in the same direction, the entry will be more than successful because as everyone knows, the higher the TF, the more security we will have. Swing Traders can use this configuration.
- But you can also take a trade with 2 timeframes that coincide, for example H1+H4, because even if the daily candle is against the direction there are movements of many pips against the direction of the daily candle as well. We will know then, that it is possible that this trend will not last several hours. Scalpers can work extremely well in this scenario.
2. Trend power
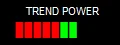
This indicator shows the power of the current movement.
Normally, when a trend is about to change, it first slows down its power. This indicator is based on the ADX value and is another help to establish the real power of the current market movement and avoid false entries because if we do not see strength in the current movement it is possible that it is about to end.
The ADX reading answers one question only. It says whether the move still has fuel. Therefore a strong direction with weak power becomes a warning rather than an invitation.
In the next image, we will see a decreased power, which may mean an imminent change of trend or a deep correction.
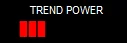
3. Candles trend direction
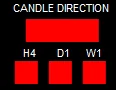
This indicator shows the direction of the current candlestick in the current timeframe (H1) and the direction of the H4 and D1 candlesticks.
In this case, this indicator would be telling us that we should only open SELL trades, if both in the current TF and in the following ones the price is down, no matter how much we see a bullish opportunity (even if a green dot appears giving a buy signal) we will not open any trade until all the DIRECTION detection indicators are in agreement.
4. All TF trend direction
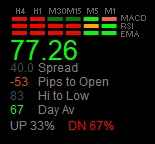
This indicator is the result of the cross of Emas, MACD and RSI. At a glance we can see how this pair is at the time of taking a trade, it also facilitates the task of knowing what our current spread is because if it is very high for example and we see that the candles have little movement, perhaps it would be advisable not to open a trade.
It also tells us how long it has been up or down since the opening.
5. Current TF trend direction (H1 O1)
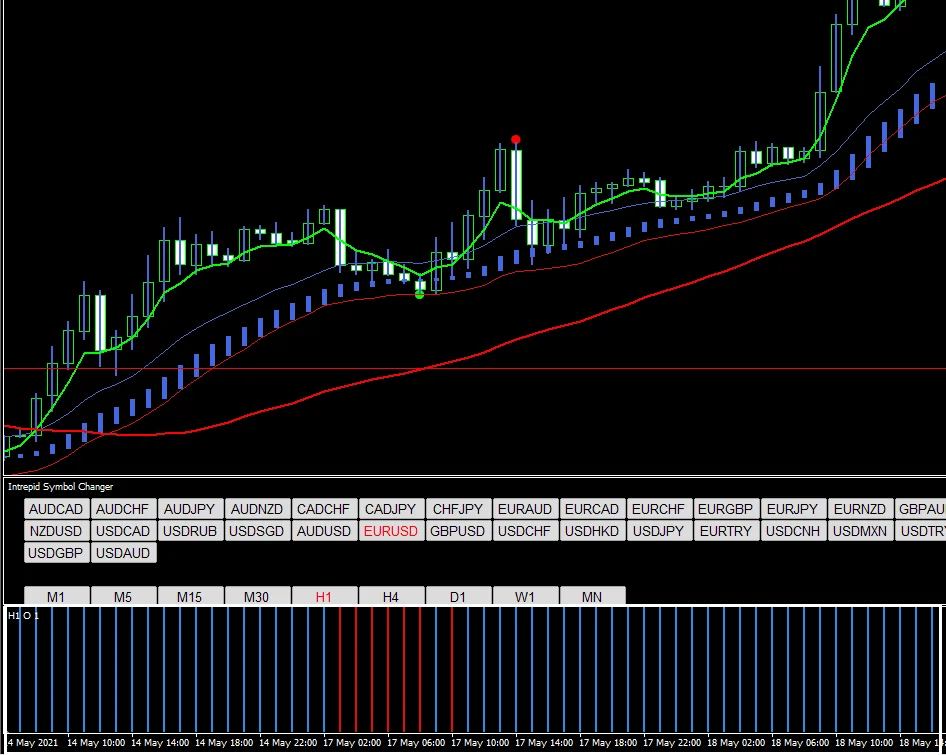
This indicator will show candlestick by candlestick the direction of the trend, how many past candlesticks were of the same trend and will give us at a glance the main idea of the trend.
Once we have seen all the indicators, let us see how to perform a trade.
Buy trades with the h1 power trend
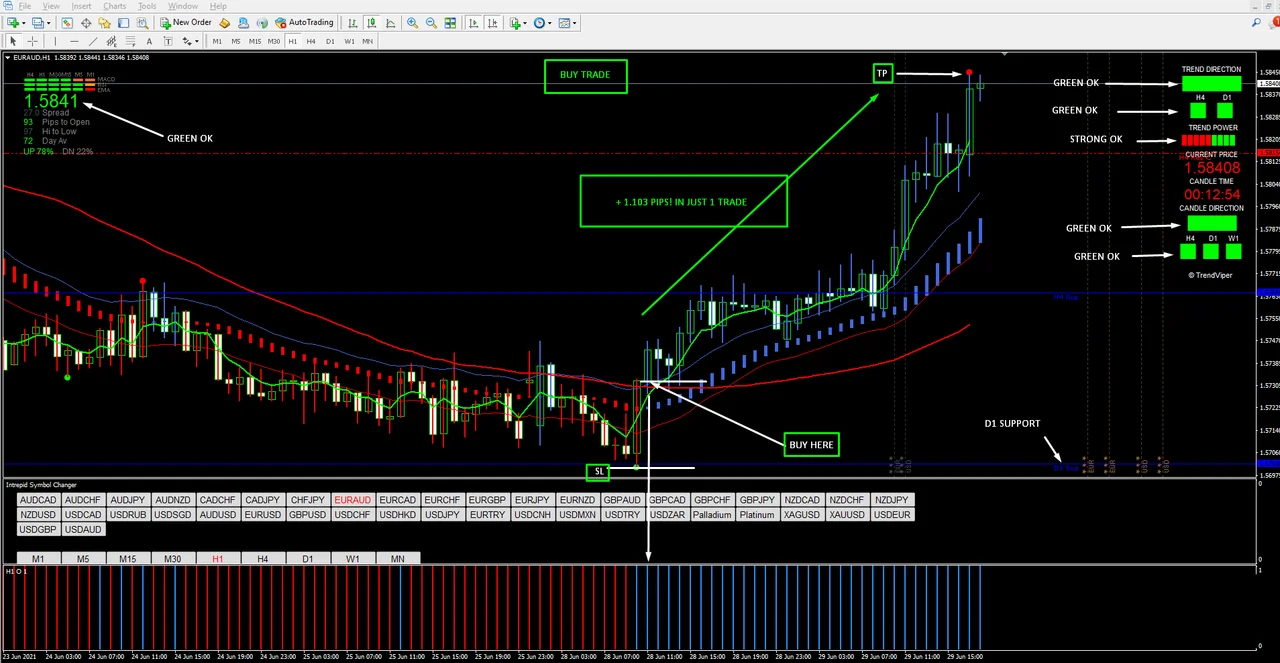
As we can see in the image above: all indicators show that the direction of the trend is bullish.
So, conditions to take a BUY TRADE:
- INDICATOR H1O1: BLUE (it is preferable that it has just started to change color from red to blue)
- TREND DIRECTION: H1 + H4 GREEN (SCALPING). H1 + H4 + D1 GREEN (SWING TRADING)
- TREND POWER: STRONG (you will need to see the full red color + at least 2 green lines)
- CANDLE DIRECTION: H1 GREEN + H4 GREEN (SCALPING). H1 + H4 + D1 GREEN (SWING TRADING)
If all these match, you can check for the last one
ALL TF TREND DIRECTION: You should look for the great majority of TF to be in GREEN: MACD, RSI and EMA crossover.
NORMALLY IF ALL THE OTHER INDICATORS ARE IN POSITION, THIS INDICATOR WILL CONFIRM THE ENTRY, BUT IF THERE ARE DOUBTS IT WILL NOT.
If you do Scalping, you can also take trades with the H1 color only in your favor expecting few pips of TP and placing a very short SL.
Stop loss and take profit on a buy
SL: The SL is always placed BELOW the last support.
- In case you are watching your trades: Your TP will be when the red dot appears and the confirmation of TREND DIRECTION in H1 (red) + TREND POWER (deceleration).
- In case you don’t stay in front of the screen: The TP is placed in the ratio 1 SL / 3 TP , i.e. if your SL is 100 pips, your TP will be 300 pips.
Sell trades with the h1 power trend
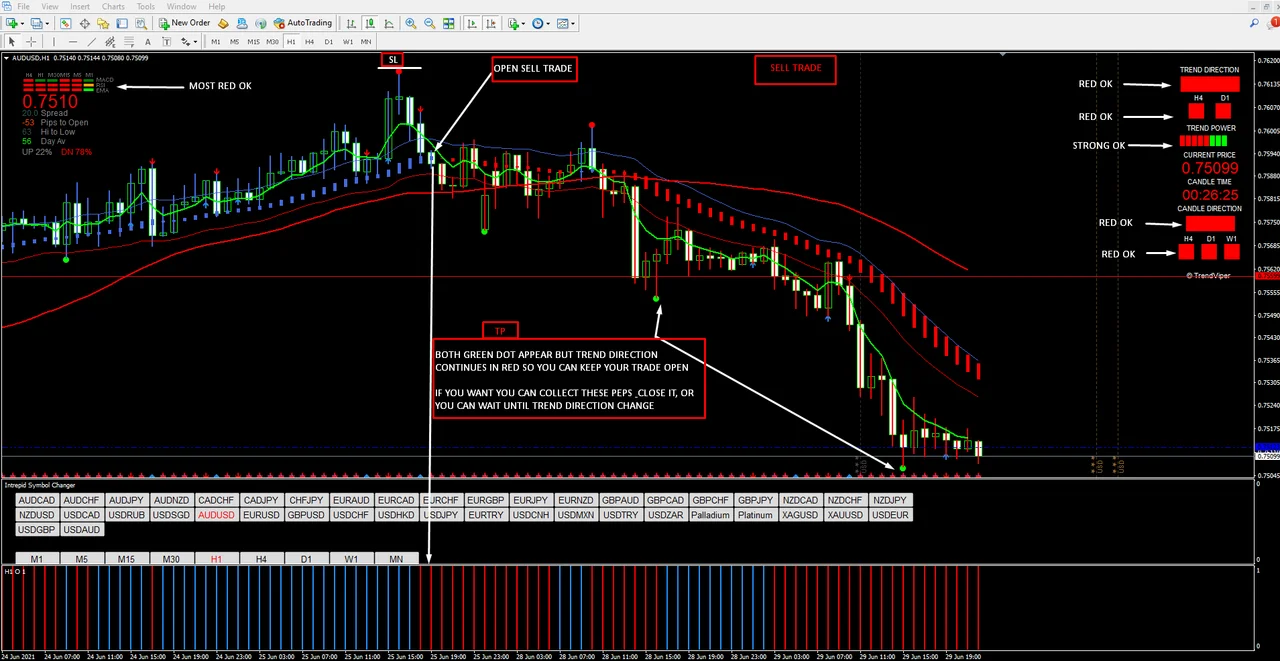
As we can see in the image above: all indicators show that the direction of the trend is bearish.
So, conditions to take a SELL TRADE:
- INDICATOR H1O1: RED (it is preferable that it has just started to change color from blue to red)
- TREND DIRECTION: H1 + H4 RED (SCALPING). H1 + H4 + D1 RED (SWING TRADING)
- TREND POWER: STRONG (you will need to see the full red color + at least 2 green lines)
- CANDLE DIRECTION: H1 RED + H4 RED (SCALPING). H1 + H4 + D1 RED (SWING TRADING)
If all these match, you can check for the last one
ALL TF TREND DIRECTION: You should look for the great majority of TF to be in RED: MACD, RSI and EMA crossover.
NORMALLY IF ALL THE OTHER INDICATORS ARE IN POSITION, THIS INDICATOR WILL CONFIRM THE ENTRY, BUT IF THERE ARE DOUBTS IT WILL NOT.
If you do Scalping, you can also take trades with the H1 color only in your favor expecting few pips of TP and placing a very short SL.
Stop loss and take profit on a sell
SL: The SL is always placed ABOVE the last resistance.
- In case you are watching your trades: Your TP will be when the green dot appears and the confirmation of TREND DIRECTION in H1 (green) + TREND POWER (deceleration).
- In case you don’t stay in front of the screen: The TP is placed in the ratio 1 SL / 3 TP , i.e. if your SL is 100 pips, your TP will be 300 pips.
Both sides share the same ratio, so the maths never changes. Because the target sits three times further than the stop, one good trade covers a handful of failures. However, that only works when you respect the stop, therefore write it down before you click.
How the h1 power trend avoids false signals
THIS IS THE BEST STRATEGY TO AVOID FALSE ENTRIES OR ENTRIES WITH A FEW PIPS.
I would like to point out the following: How to avoid false signals ?
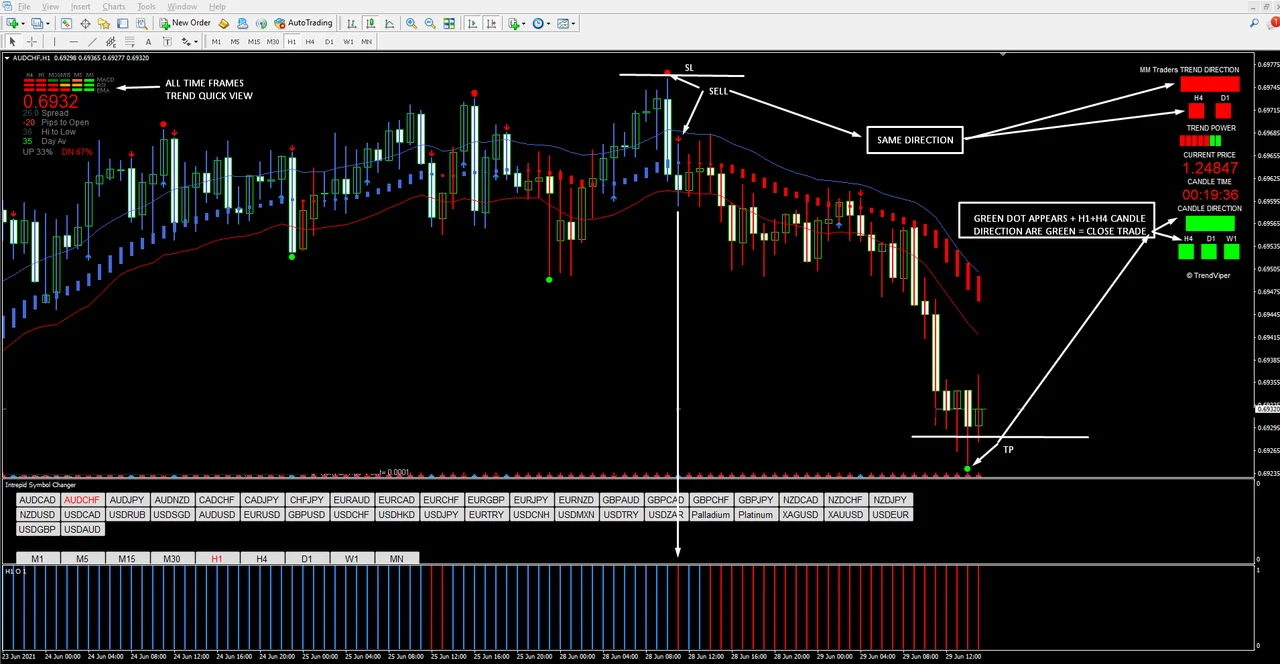
The green dot detects some resistance of the price to continue going down, indicating a possible bullish entry (BUY), or as in this case, close the sell trade if we had entered SELL in the previous entry (and we do not want to wait for the confirmation of a trend change because we consider that we have already collected many pips and we do not want to risk them), so, if you take into account all the trend indicators, absolutely all of them tell you that it is still a bearish trend. Trend direction + Trend Power + Candle Direction + Ema Signal + H1O1 = bearish trend.
- It is possible to have some correction or pullback (beause of green dot), but none detects a real change of trend to be able to make our entry, which means that the price can rest for a moment and then most likely continue down. So, it’s great to be able to know in advance that a trade could fail.
Scalping or swing trading
The same screen serves two very different styles. A scalper waits for H1 and H4 to agree and then takes a short target. A swing trader adds D1 to the list and gives the move more room. In addition, the spread information helps on quiet hours, since a wide spread eats a small target first.
What will I receive?
- 9 MT4 Indicators .ex4
- 1 MT4 Template .tpl
- How to install indicators and template Manual
- Strategy Manual
Installing the h1 power trend on MT4
Setup takes a couple of minutes. First, open MetaTrader 4 and click File > Open Data Folder. Then copy the nine indicator files into the Indicators folder and the template into the Templates folder, both inside that data folder. Next, restart the platform or refresh the Navigator panel. Finally, open an H1 chart and apply the template, so all five windows appear at once.
Before you trade
Read the strategy manual first, because the rules only work as a full set. In addition, follow a couple of pairs at the beginning, since five windows on ten symbols become noise. Trading involves risk, therefore only trade with money you can afford to lose. Past results do not guarantee future results. You trade at your own risk.
If you have any questions please do not hesitate to contact us!
Instant download after purchase. Questions? Write to info@binaryforexea.com.
Do you want more manual tools for the spot market? Then browse our range for Forex. Looking for automated robots as well? Then check all our Expert Advisors.